Learn It
Should I use the mean or the median?
The mean and the median both describe the center of a data set, but one fits better depending on the shape. When the data has an outlier (a value far from the rest), the median is usually the better choice.
Picture itSee what the math looks like before you read about it
Watch me solve itI do — read one step at a time
- My data, the top scorer's points: 22, 24, 20, 25, 23, 21, 58. I notice 58 is much bigger than the rest, so it is an .
- : 22 + 24 + 20 + 25 + 23 + 21 + 58 = 193, then 193 ÷ 7 ≈ 27.6.22 + 24 + 20 + 25 + 23 + 21 + 58 = 193
- : in order they are 20, 21, 22, 23, 24, 25, 58. The middle (4th) value is 23.
- The (27.6) is higher than 6 of the 7 games because 58 pulled it up. So the (23) better shows a typical game.
Watch out — mistakes students make here
- True, but 72 pulls the mean up — an outlier distorts it.
- Not always — a big outlier like 72 makes the median better.
- One does work — the median resists the outlier 72.
Try it with meWe do — you answer first, then check
Same steps, new numbers.
- Data set A: 4, 5, 6, 7, 8. Are there any ?
Check this step
If not, which measure should we use, or ? - Data set B: 4, 5, 6, 7, 40. Which value is an here?
- For data set B, would the pull the up or down?
Check this step
So which measure best shows a typical value?
On your ownYou do — solve this one by yourself
Before you start, remember:
- For each one, look for an or a shape to decide.
Solve: A baseball player's batting averages over 6 seasons are: .280, .295, .290, .285, .300, .110. The .110 was an injury-shortened season. Which measure better represents the player's typical batting average?
My answer
Stuck? Open one hint at a time.
Hint 1
Five seasons sit between .280 and .300; the .110 season is far below them — a low outlier.
Hint 2
A low outlier drags one measure DOWN below the player's usual level. Think about which measure uses only the middle of the ordered list.
Hint 3
First step: order the six averages and find the two middle ones. Notice that .110 sits at the far end and never touches that middle.
Check my answer
The .110 is an outlier that pulls the mean down to .260. The median (.2875) better represents typical performance because it isn't affected by the extreme value.
Turn & TalkSay it out loud with a partner
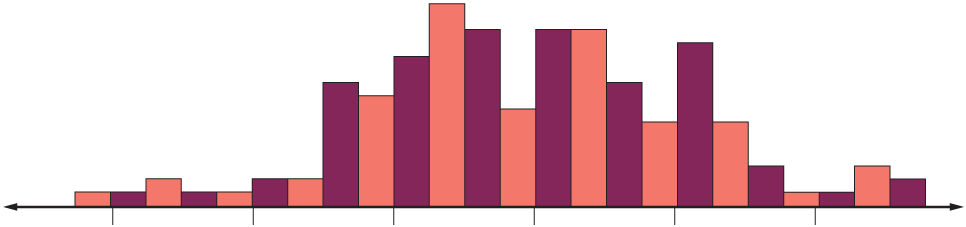
The students collected years of teaching experience. What would make you choose the instead of the to describe this data?
Try starting with:
- I think ___ because ___.Pienso que ___ porque ___.
- I agree / disagree with you because ___.Estoy / no estoy de acuerdo contigo porque ___.