Unit 2 · Standard 6.DS.6d
🔑 Choose Appropriate Measures — Vocab Explorer
① Word Wall
Look at the picture, read the meaning, and tap 🔊 to hear each word.
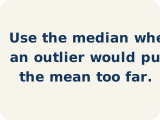
ES Medidas de centro apropiadas
A mean, median, or mode chosen because it describes a data set fairly.
Una media, mediana o moda elegida porque describe un conjunto de datos de manera justa.

ES Media
The average. Add all the numbers, then divide by how many there are.
El promedio. Suma todos los números y divide entre cuántos hay.

ES Mediana
The middle number when you put them in order.
El número del medio cuando los pones en orden.

ES Valor atípico
A number that is much bigger or smaller than the rest.
Un número mucho mayor o menor que los demás.
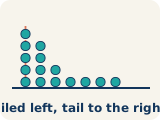
ES Sesgado
When most data sits on one side with a tail on the other.
Cuando la mayoría de los datos está de un lado con una cola del otro.

ES Distribución de datos
How the data looks: where it sits and how spread out it is.
Cómo se ven los datos: dónde están y qué tan separados están.

ES Variabilidad
How spread out the numbers are.
Qué tan separados están los números.

ES Grupo
Values bunched close together in one part of a display.
Valores agrupados muy cerca en una parte de la representación.

ES Brecha
A space on a display where no data values fall.
Un espacio en la representación donde no cae ningún valor de los datos.
② Match it
Tap a word, then tap its meaning.
③ Fill in the blank
Use the word bank to finish each sentence.
- 1A center chosen because it describes the data fairly is an .
- 2The average of a data set is the .
- 3The middle value when data is in order, often best when there is an outlier, is the .
- 4A value far from the rest of the data, which can pull the mean, is an .
- 5Data that is bunched on one side with a tail on the other is .
- 6The way data values are spread out is the .
- 7How much the data values differ is the .
- 8Values bunched close together in one spot form a .
- 9A space where no values fall on a display is a .
④ Use it in a sentence
Pick one word and finish the sentence in your own words.
A is .