Unit 2 · Standard 6.DS.5
🔑 Represent and Describe Data in a Histogram — Vocab Explorer
① Word Wall
Look at the picture, read the meaning, and tap 🔊 to hear each word.
ES Representar datos con histogramas
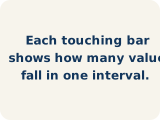
Group numerical data into intervals and show each interval's frequency with a bar.
Agrupar datos numéricos en intervalos y mostrar la frecuencia de cada intervalo con una barra.

ES Histograma
A bar graph that groups data into equal ranges. The bars touch.
Una gráfica de barras que agrupa datos en rangos iguales. Las barras se tocan.

ES Frecuencia
How many times a value shows up.
Cuántas veces aparece un valor.
ES Intervalo
A range of numbers used to group data.
Un rango de números para agrupar datos.

ES Distribución
How the data is spread out.
Cómo están repartidos los datos.

ES Variabilidad
How spread out the numbers are.
Qué tan separados están los números.
ES Tabla de frecuencias
A table that lists each interval and how many values fall in it.
Una tabla que muestra cada intervalo y cuántos valores caen en él.
ES Forma de los datos
The pattern the bars or dots make across the intervals.
El patrón que forman las barras o los puntos a lo largo de los intervalos.

ES Pico
The tallest bar or stack in a data display.
La barra o pila más alta en una representación de datos.
② Match it
Tap a word, then tap its meaning.
③ Fill in the blank
Use the word bank to finish each sentence.
- 1A histogram groups numerical data into equal and shows each one's .
- 2A bar graph that shows how often data falls into equal intervals is a .
- 3How many data values fall in an interval is the .
- 4An equal-sized range of values used to group data is an .
- 5The overall pattern of how data is spread out is the .
- 6How much the data values differ is the .
- 7A table that lists each interval and its count is a .
- 8The pattern the bars make across a display is the .
- 9The tallest bar in a display is the .
④ Use it in a sentence
Pick one word and finish the sentence in your own words.
A is .