Touch and changeToca y cambia
Move, type, tap, or drag in the model. Watch what changes.Mueve, escribe, toca o arrastra en el modelo. Observa qué cambia.
Unit 2 · Understanding the World Around Us Through Statistics Unidad 2 · Entender el mundo que nos rodea con la estadística
Represent and Describe Data in a Box PlotRepresentar y describir datos en un diagrama de caja
6.DS.5 ▾This lesson builds proficiency in Grade 6 mathematical standard 6.DS.5.Esta lección desarrolla destrezas en el estándar matemático de 6.º grado 6.DS.5.
Optional, ungraded practice. Choose ONE plan below. Work with someone or on your own; no adult signature is needed. Práctica opcional, sin calificación. Elige UN plan abajo. Trabaja con alguien o a solas; no necesitas la firma de un adulto.
Choose one plan, not all three. Each plan tells you what to do and when to stop. Switching keeps your answers.Elige un plan, no los tres. Cada plan indica qué hacer y cuándo terminar. Al cambiar, conservas tus respuestas.
Learn & practice selected: 4 focused stops and all 6 core problems, about 20 minutes. Ruta de aprendizaje: 4 paradas y los 6 problemas, unos 20 minutos.
The Photobooth is a camera you can open any time — photograph the notebook page, the scratchpad or the whiteboard, add a frame and stickers, then download or print it. It is optional, and the photo stays on this device. La cabina de fotos es una cámara que pueden abrir cuando quieran: fotografíen la página del cuaderno, el borrador o la pizarra, agreguen un marco y calcomanías, y descárguenla o imprímanla. Es opcional, y la foto se queda en este dispositivo.
💡 Draw fraction bars, tape diagrams, equations, or line up decimals together!💡 ¡Dibujen barras de fracciones, modelos o alineen decimales juntos!
Tonight we build a box plot, a simple picture that shows how data is spread out using five key numbers.
Esta noche construimos un diagrama de caja, un dibujo sencillo que muestra cómo se reparten los datos con cinco números clave.
For the grown-up helping tonightPara el adulto que ayuda hoy
min 2 | Q1 4 | median 7 | Q3 10 | max 12
Real example, the scores in order: 4, 6, 8, 10, 12, 14, 15, 18, 22, 24, 28.
Ejemplo real, los puntajes en orden: 4, 6, 8, 10, 12, 14, 15, 18, 22, 24, 28.
There are 11 numbers.
Hay 11 números.
The middle number is the 6th one, 14, so the median = 14.
El número del medio es el 6.º, 14, así que la mediana = 14.
It splits the data in half.
Divide los datos en dos mitades.
The lower half is 4, 6, 8, 10, 12; its middle is 8, so Q1 = 8.
La mitad de abajo es 4, 6, 8, 10, 12; su medio es 8, así que Q1 = 8.
The upper half is 15, 18, 22, 24, 28; its middle is 22, so Q3 = 22.
La mitad de arriba es 15, 18, 22, 24, 28; su medio es 22, así que Q3 = 22.
The lowest is 4 and the highest is 28.
El más bajo es 4 y el más alto es 28.
Draw a box from 8 to 22, a line at 14, and whiskers out to 4 and 28.
Dibuja una caja de 8 a 22, una línea en 14, y bigotes hasta 4 y 28.
Listen for "cuartil" — quartiles split the data into four equal parts. Q1 and Q3 are the edges of the box.
Escucha "cuartil" — los cuartiles dividen los datos en cuatro partes iguales. Q1 y Q3 son los bordes de la caja.
Listen for "rango intercuartílico" — it is the spread of the middle half (Q3 − Q1).
Escucha "rango intercuartílico" — es la extensión de la mitad central (Q3 − Q1).
Remind your student: find the median first, then split into halves to find Q1 and Q3.
Recuérdale a tu estudiante: encuentra la mediana primero, luego divide en mitades para hallar Q1 y Q3.
Change the numbers. Explain what the picture shows.Cambia los números. Explica qué muestra el dibujo.
🌐 Esta herramienta interactiva por ahora solo está en inglés. Para qué sirve: Coloca el resumen de cinco números sobre una recta numérica encima de los datos reales y construye la caja y los bigotes. Usen los pasos en español de esta tarjeta para guiarse.
Move, type, tap, or drag in the model. Watch what changes.Mueve, escribe, toca o arrastra en el modelo. Observa qué cambia.
Record one equation, value, or relationship you can see.Escribe una ecuación, un valor o una relación que puedas ver.
I notice ___ changes when ___ changes. This shows ___.Noto que ___ cambia cuando ___ cambia. Esto muestra ___.
Ask: "Where do you see the numbers from tonight's math in this model?"Pregunta: "¿Dónde ves los números de la tarea de hoy en este modelo?"
Order these six book lengths: 2, 4, 6, 8, 10, 12. Ordena estas seis longitudes de libros: 2, 4, 6, 8, 10, 12.
Using a familiar rule before identifying what this question asks. Usar una regla conocida sin identificar qué pide esta pregunta.
Tap a word on the left, then tap its matching definition on the right! ¡Toca una palabra a la izquierda y su significado a la derecha!
Tap any card to flip and explore its definition and example. Toca cualquier tarjeta para voltearla y explorar su definición y ejemplo.
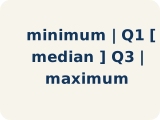
Representar datos con diagramas de caja
Representar datos con diagramas de caja
Show a data set's five-number summary in a box-and-whisker display.
ES Mostrar el resumen de cinco números de un conjunto de datos en un diagrama de caja y bigotes.
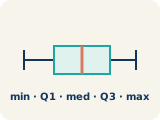
Diagrama de caja
Diagrama de caja
A graph that shows how data is spread using five key numbers.
ES Una gráfica que muestra cómo se reparten los datos con cinco números clave.
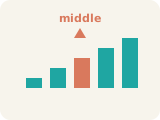
Mediana
Mediana
The middle number when you put them in order.
ES El número del medio cuando los pones en orden.
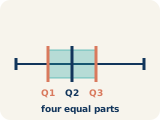
Cuartil
Cuartil
Numbers that split the data into four equal parts.
ES Números que dividen los datos en cuatro partes iguales.
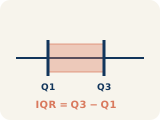
Rango intercuartílico
Rango intercuartílico
The spread of the middle half of the data (Q3 − Q1).
ES La extensión de la mitad central de los datos (Q3 − Q1).
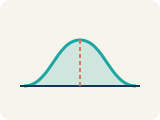
Distribución de datos
Distribución de datos
How the data looks: where it sits and how spread out it is.
ES Cómo se ven los datos: dónde están y qué tan separados están.
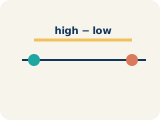
Variabilidad
Variabilidad
How spread out the numbers are.
ES Qué tan separados están los números.
Resumen de cinco números
Resumen de cinco números
The minimum, first quartile, median, third quartile, and maximum of a data set.
ES El mínimo, el primer cuartil, la mediana, el tercer cuartil y el máximo de un conjunto de datos.
Bigote
Bigote
A line on a box plot that reaches from the box out to the least or greatest value.
ES Una línea en un diagrama de caja que va desde la caja hasta el valor menor o mayor.
Mitad central
Mitad central
The values from the first quartile to the third quartile, which the box covers.
ES Los valores desde el primer cuartil hasta el tercer cuartil, que la caja cubre.
Student: explain. Partner: ask “How do you know?” Then switch. Working solo? Say or write your explanation; bring a question to a trusted adult at school.Estudiante: explica. Acompañante: pregunta «¿Cómo lo sabes?» Luego cambien. ¿Trabajas a solas? Di o escribe tu explicación; lleva una pregunta a un adulto de confianza en la escuela.
Imagine you are making a quick picture of five game scores: 2, 5, 5, 8, 11.
Imaginen que hacen un dibujo rápido de cinco puntajes de juegos: 2, 5, 5, 8, 11.
Work side by side. You ask questions; your student does the thinking. Trabajen juntos. Tú haces preguntas; tu estudiante piensa.
Find the median. With 5 numbers in order, which one is in the middle?
Encuentren la mediana. Con 5 números en orden, ¿cuál está en el medio?
Find Q1 and Q3: the middle of the lower half (2, 5) and the middle of the upper half (8, 11).
Encuentren Q1 y Q3: el medio de la mitad de abajo (2, 5) y el medio de la mitad de arriba (8, 11).
The lowest is 2 and the highest is 11. Picture the box from 3.5 to 9.5 with a line at 5 inside.
El más bajo es 2 y el más alto es 11. Imaginen la caja de 3.5 a 9.5 con una línea en 5 adentro.
Do these together. Start at ★ and climb to ★★★ when ready. Háganlos juntos. Empiecen en ★ y suban a ★★★ cuando estén listos.
A box plot of minutes spent walking a dog shows: minimum 5, Q1 9, median 12, Q3 16, maximum 20. Where does the box start and end?Un diagrama de caja de minutos paseando a un perro muestra: mínimo 5, Q1 9, mediana 12, Q3 16, máximo 20. ¿Dónde empieza y termina la caja?
A. From 9 to 16A. De 9 a 16
A family picked 3, 5, 6, 8, 9, and 11 tomatoes on six days. What is Q1?Una familia recogió 3, 5, 6, 8, 9 y 11 tomates en seis días. ¿Cuál es Q1?
D. 5D. 5
Team A has minimum 4, Q1 8, median 14, Q3 22, and maximum 28 points. What is its IQR?El equipo A tiene mínimo 4, Q1 8, mediana 14, Q3 22 y máximo 28 puntos. ¿Cuál es su rango intercuartílico?
A. 14A. 14
A box plot shows minimum 2, Q1 5, median 8, Q3 11, maximum 15. Which interval contains the middle 50%?Un diagrama de caja tiene mínimo 2, Q1 5, mediana 8, Q3 11 y máximo 15. ¿Qué intervalo contiene el 50% central?
B. 5–11B. 5–11
Eight kids read for 10, 12, 15, 17, 20, 22, 26, and 30 minutes. What is the five-number summary (min, Q1, median, Q3, max)?Ocho niños leyeron 10, 12, 15, 17, 20, 22, 26 y 30 minutos. ¿Cuál es el resumen de cinco números (mín, Q1, mediana, Q3, máx)?
B. 10, 13.5, 18.5, 24, 30B. 10, 13.5, 18.5, 24, 30
Point and name → finish the sentence → explain in your own words.Señala y nombra → completa la oración → explica con tus propias palabras.
The data show ___ because ___.Los datos muestran ___ porque ___.
Check: I answered the question, showed my thinking, labeled units, and explained why.Reviso: respondí la pregunta, mostré mi razonamiento, indiqué las unidades y expliqué por qué.
"Can you show me how you see that in your work or a quick sketch?" "¿Puedes mostrarme cómo ves eso en tu trabajo o en un dibujo rápido?"
Follow-up: Point to where each number from the problem shows up. Seguimiento: Señala dónde aparece cada número del problema.
Try the recommended mission. Student: explain; partner: ask one question, then switch. Paper drawings work for every object. Prueba la misión recomendada. Estudiante: explica; acompañante: haz una pregunta, luego cambien. Puedes dibujar los objetos en papel.
One mission is enough. You can also work solo and explain in writing.Una misión es suficiente. También puedes trabajar a solas y explicar por escrito.
Collect six page counts from books, or use 8, 12, 12, 16, 20, 28. Apply tonight’s statistical question, display, or measure. Label what the numbers represent and explain one conclusion.
Recoge seis cantidades de páginas de libros, o usa 8, 12, 12, 16, 20, 28. Usa la pregunta, representación o medida estadística de hoy. Indica qué representan los números y explica una conclusión.
Show a labeled drawing, table, or equation. Your partner asks one question; working alone, write your explanation.
Muestra un dibujo con etiquetas, una tabla o una ecuación. Tu acompañante hace una pregunta; a solas, escribe tu explicación.
⏱️ About 8 minutes for the 6 problems below. The extra practice at the bottom is optional. ⏱️ Unos 8 minutos para los 6 problemas de abajo. La práctica extra al final es opcional.
A few problems to practice together. Each one has a step-by-step guide, a picture to draw on, and a space to show your work. Use Check This Problem for instant feedback — no need to finish everything at once. Unos problemas para practicar juntos. Cada uno tiene una guía paso a paso, un dibujo para trabajar y un espacio para mostrar el trabajo. Usen Revisar esta pregunta para retroalimentación al instante — no tienen que terminar todo de una vez.
Easier problems to practice the idea. Do these first together. Problemas más fáciles para practicar la idea. Hagan estos primero juntos.
Say the question in your own words. Circle what you know and underline what you need to find.
Explica la pregunta con tus propias palabras. Encierra lo que sabes y subraya lo que debes hallar.
Q1 is the median of the lower half. Q3 is the median of the upper half.
Q1 es la mediana de la mitad inferior. Q3 es la mediana de la mitad superior.
Start here: Always order the data first before finding any measures.
Empieza aquí: Ordena siempre los datos antes de hallar cualquier medida.
Order the steps for making a box plot.Ordena los pasos para hacer un diagrama de caja.
👪 On a phone, use Move to. On a computer, drag cards or tap a card then tap a column.👪 En el teléfono usen Mover a. En la computadora arrastren o toquen tarjeta y columna.
💡 Always order the data first before finding any measures.Ordena siempre los datos antes de hallar cualquier medida.
💡 Q1 is the median of the lower half. Q3 is the median of the upper half.Q1 es la mediana de la mitad inferior. Q3 es la mediana de la mitad superior.
Answer key for families — compare, then talk about why.Clave de respuestas para la familia — comparen y hablen del porqué.
Not tried yet? Close this and give it one try first. A wrong first try still helps.¿Todavía no lo intentaron? Ciérrenla y hagan un intento primero. Un primer intento equivocado también ayuda.
Why:Por qué: The order matters because every step depends on the one before it. The data has to be sorted before a middle value means anything, the median has to be found before the list splits into a lower and an upper half, and Q1 and Q3 have to exist before you can draw the box from Q1 to Q3 with whiskers out to the minimum and maximum.El orden importa porque cada paso depende del anterior. Los datos tienen que estar ordenados antes de que un valor del medio signifique algo, la mediana tiene que hallarse antes de que la lista se divida en una mitad inferior y una superior, y Q1 y Q3 tienen que existir antes de poder dibujar la caja de Q1 a Q3 con los bigotes hasta el mínimo y el máximo.
Say the question in your own words. Circle what you know and underline what you need to find.
Explica la pregunta con tus propias palabras. Encierra lo que sabes y subraya lo que debes hallar.
Use the halves rule: Q1 is the middle of the LOWER half, Q3 the middle of the UPPER half, and IQR is the gap between them.
Usa la regla de las mitades: Q1 es el medio de la mitad INFERIOR, Q3 el de la mitad SUPERIOR, y el RIC es la distancia entre ellos.
Start here: Think of the five-number summary in order: Min, Q1, Median, Q3, Max — plus IQR, which measures the box's width.
Empieza aquí: Piensa en el resumen de cinco números en orden: Mín, Q1, Mediana, Q3, Máx, más el RIC, que mide el ancho de la caja.
Match each box plot term to its meaning.Une cada término del diagrama de caja con su significado.
👪 Say each term out loud, then talk through which match makes sense before choosing.👪 Digan cada término en voz alta y hablen de cuál pareja tiene sentido antes de elegir.
Answer key for families — compare, then talk about why.Clave de respuestas para la familia — comparen y hablen del porqué.
Not tried yet? Close this and give it one try first. A wrong first try still helps.¿Todavía no lo intentaron? Ciérrenla y hagan un intento primero. Un primer intento equivocado también ayuda.
Why:Por qué: The five-number summary runs Min, Q1, Median, Q3, Max from the smallest value to the largest, with Q1 and Q3 defined as the medians of the lower and upper halves. The IQR is not a location at all — it is the distance Q3 − Q1, which tells you how far the middle 50% of the data spreads.El resumen de cinco números va Mín, Q1, Mediana, Q3, Máx, del valor más pequeño al más grande, y Q1 y Q3 se definen como las medianas de la mitad inferior y la superior. El IQR no es una posición: es la distancia Q3 − Q1, que indica qué tanto se extiende el 50% central de los datos.
Say the question in your own words. Circle what you know and underline what you need to find.
Explica la pregunta con tus propias palabras. Encierra lo que sabes y subraya lo que debes hallar.
If a card describes one value you could point to on the plot, it belongs with the five-number summary; if it describes a subtraction, it measures spread.
Si una tarjeta describe un solo valor que podrías señalar en el diagrama, va con el resumen de cinco números; si describe una resta, mide la dispersión.
Start here: Some of these cards name a spot in the data, and others name a distance between two spots.
Empieza aquí: Algunas de estas tarjetas nombran un punto dentro de los datos y otras nombran una distancia entre dos puntos.
Each card describes a part of the stadium box plot. Sort each card under the matching box plot part.Cada tarjeta describe una parte del diagrama de caja del estadio. Clasifica cada tarjeta bajo la parte del diagrama que le corresponde.
💡 Some of these cards name a spot in the data, and others name a distance between two spots.Algunas de estas tarjetas nombran un punto dentro de los datos y otras nombran una distancia entre dos puntos.
💡 If a card describes one value you could point to on the plot, it belongs with the five-number summary; if it describes a subtraction, it measures spread.Si una tarjeta describe un solo valor que podrías señalar en el diagrama, va con el resumen de cinco números; si describe una resta, mide la dispersión.
💡 Start with "The minimum — the lowest score": that is one single value in the data set, so decide which bin it goes in, then look at the cards that say "minus".Empieza con "El mínimo: el puntaje más bajo": ese es un solo valor del conjunto de datos, así que decide en qué caja va y luego revisa las tarjetas que dicen "menos".
Answer key for families — compare, then talk about why.Clave de respuestas para la familia — comparen y hablen del porqué.
Not tried yet? Close this and give it one try first. A wrong first try still helps.¿Todavía no lo intentaron? Ciérrenla y hagan un intento primero. Un primer intento equivocado también ayuda.
Why:Por qué: The five-number summary names five positions in the data — minimum, Q1, median, Q3, and maximum — and each one is a single value you could mark on the number line. IQR = Q3 − Q1 and range = maximum − minimum are different: each is a subtraction that reports a distance, which is why they belong under measures of spread.El resumen de cinco números nombra cinco posiciones en los datos —mínimo, Q1, mediana, Q3 y máximo— y cada una es un solo valor que podrías marcar en la recta numérica. IQR = Q3 − Q1 y rango = máximo − mínimo son distintos: cada uno es una resta que informa una distancia, y por eso pertenecen a las medidas de dispersión.
Try these once the warm-up feels easy. It's okay to use the steps and pictures. Intenten estos cuando el calentamiento sea fácil. Está bien usar los pasos y los dibujos.
Say the question in your own words. Circle what you know and underline what you need to find.
Explica la pregunta con tus propias palabras. Encierra lo que sabes y subraya lo que debes hallar.
Split the cards into two groups: the two about whiskers or the median line (symmetry vs skew), and the two about box size (small vs large IQR).
Divide las tarjetas en dos grupos: las dos sobre bigotes o la línea de la mediana (simetría frente a asimetría) y las dos sobre el tamaño de la caja (RIC pequeño o grande).
Start here: Each feature is about shape: whisker length shows skew, box size shows how spread out the middle 50% is.
Empieza aquí: Cada característica es sobre la forma: el largo de los bigotes muestra la asimetría y el tamaño de la caja muestra qué tan disperso está el 50% central.
Match each box plot feature with what it tells you about the data.Une cada característica del diagrama de caja con lo que te dice sobre los datos.
Answer key for families — compare, then talk about why.Clave de respuestas para la familia — comparen y hablen del porqué.
Not tried yet? Close this and give it one try first. A wrong first try still helps.¿Todavía no lo intentaron? Ciérrenla y hagan un intento primero. Un primer intento equivocado también ayuda.
Why:Por qué: A box plot's shape carries the story. A long right whisker beside a short left one means a few high values stretch away from the box, which is skewed right, while a median line sitting in the center of the box means the middle 50% is roughly symmetric. Box width is about consistency: a small box is a small IQR and tightly clustered data, and a large box is a large IQR and high variability.La forma de un diagrama de caja cuenta la historia. Un bigote derecho largo junto a uno izquierdo corto significa que unos pocos valores altos se alejan de la caja, es decir, sesgo a la derecha, mientras que una línea de la mediana en el centro de la caja significa que el 50% central es casi simétrico. El ancho de la caja habla de consistencia: una caja pequeña es un IQR pequeño y datos muy agrupados, y una caja grande es un IQR grande y mucha variabilidad.
Say the question in your own words. Circle what you know and underline what you need to find.
Explica la pregunta con tus propias palabras. Encierra lo que sabes y subraya lo que debes hallar.
Compare a narrow box (IQR 8) with a wide box (IQR 22). Ask what narrow vs wide says about consistency — not about which team is better.
Compara una caja angosta (RIC 8) con una caja ancha (RIC 22). Pregunta qué dice angosta frente a ancha sobre la consistencia, no sobre qué equipo es mejor.
Start here: IQR measures the width of the box — how spread out the MIDDLE 50% of each team's scores is.
Empieza aquí: El RIC mide el ancho de la caja: qué tan dispersos están los puntajes del 50% CENTRAL de cada equipo.
Two box plots show: Team A has IQR = 8, Team B has IQR = 22. What does this tell you?Dos diagramas de caja muestran: el equipo A tiene un RIC = 8 y el equipo B tiene un RIC = 22. ¿Qué te dice esto?
👪 Read the question together, then let your student pick an answer before you discuss why.👪 Lean la pregunta juntos; dejen que su estudiante elija antes de hablar del porqué.
Answer key for families — compare, then talk about why.Clave de respuestas para la familia — comparen y hablen del porqué.
Not tried yet? Close this and give it one try first. A wrong first try still helps.¿Todavía no lo intentaron? Ciérrenla y hagan un intento primero. Un primer intento equivocado también ayuda.
Why:Por qué: A smaller IQR means the middle 50% of data is more tightly clustered. Team A's scoring is more consistent in the middle range.Un RIC más pequeño significa que el 50% central de los datos está más agrupado. La anotación del equipo A es más consistente en el rango central.
Say the question in your own words. Circle what you know and underline what you need to find.
Explica la pregunta con tus propias palabras. Encierra lo que sabes y subraya lo que debes hallar.
The box stretches from Q1 on one end to Q3 on the other.
La caja se extiende desde Q1 en un extremo hasta Q3 en el otro.
Start here: In a box plot it is the box itself — not the whiskers — that holds the middle half of the data.
Empieza aquí: En un diagrama de caja es la caja misma, no los bigotes, la que contiene la mitad central de los datos.
A box plot for the Rockets shows Min = 8, Q1 = 15, Median = 22, Q3 = 30, Max = 38. The middle 50% of their scores falls between which two values?Un diagrama de caja de los Rockets muestra Mín = 8, Q1 = 15, Mediana = 22, Q3 = 30, Máx = 38. ¿El 50% central de sus puntajes queda entre qué dos valores?
Answer key for families — compare, then talk about why.Clave de respuestas para la familia — comparen y hablen del porqué.
Not tried yet? Close this and give it one try first. A wrong first try still helps.¿Todavía no lo intentaron? Ciérrenla y hagan un intento primero. Un primer intento equivocado también ayuda.
Why:Por qué: The box of a box plot stretches from Q1 to Q3, and that box always holds the middle 50% of the data. Here the box goes from Q1 = 15 to Q3 = 30.La caja de un diagrama de caja se extiende de Q1 a Q3, y esa caja siempre contiene el 50% central de los datos. Aquí la caja va de Q1 = 15 a Q3 = 30.
Optional. Only if your student wants more — these are bonus problems. Opcional. Solo si tu estudiante quiere más — son problemas adicionales.
Say the question in your own words. Circle what you know and underline what you need to find.
Explica la pregunta con tus propias palabras. Encierra lo que sabes y subraya lo que debes hallar.
IQR = Q3 − Q1. Find Q3 (28) and Q1 (15) in the summary — the IQR is their difference, the width of the box.
RIC = Q3 − Q1. Halla Q3 (28) y Q1 (15) en el resumen: el RIC es su diferencia, el ancho de la caja.
Start here: You're given five numbers, but IQR only uses two of them: Q1 and Q3. Ignore the min, median, and max.
Empieza aquí: Te dan cinco números, pero el RIC solo usa dos: Q1 y Q3. Ignora el mínimo, la mediana y el máximo.
A box plot shows: Min = 10, Q1 = 15, Median = 20, Q3 = 28, Max = 35. What is the interquartile range (IQR)?Un diagrama de caja muestra: Mín = 10, Q1 = 15, Mediana = 20, Q3 = 28, Máx = 35. ¿Cuál es el rango intercuartílico (RIC)?
Answer key for families — compare, then talk about why.Clave de respuestas para la familia — comparen y hablen del porqué.
Not tried yet? Close this and give it one try first. A wrong first try still helps.¿Todavía no lo intentaron? Ciérrenla y hagan un intento primero. Un primer intento equivocado también ayuda.
Why:Por qué: IQR = Q3 − Q1 = 28 − 15 = 13.RIC = Q3 − Q1 = 28 − 15 = 13.
Say the question in your own words. Circle what you know and underline what you need to find.
Explica la pregunta con tus propias palabras. Encierra lo que sabes y subraya lo que debes hallar.
The box runs from Q1 to Q3, so the line inside splits the middle 50% in half. Think about which measure splits ordered data into halves.
La caja va de Q1 a Q3, así que la línea de adentro parte por la mitad al 50% central. Piensa qué medida divide en mitades los datos ordenados.
Start here: Picture a box plot: a box with whiskers, and a line cutting through the box. That line marks the CENTER of the data.
Empieza aquí: Imagina un diagrama de caja: una caja con bigotes y una línea que atraviesa la caja. Esa línea marca el CENTRO de los datos.
On a box plot, what does the line inside the box represent?En un diagrama de caja, ¿qué representa la línea que está dentro de la caja?
Answer key for families — compare, then talk about why.Clave de respuestas para la familia — comparen y hablen del porqué.
Not tried yet? Close this and give it one try first. A wrong first try still helps.¿Todavía no lo intentaron? Ciérrenla y hagan un intento primero. Un primer intento equivocado también ayuda.
Why:Por qué: The line inside the box of a box plot always represents the median.La línea dentro de la caja de un diagrama de caja siempre representa la mediana.
Say the question in your own words. Circle what you know and underline what you need to find.
Explica la pregunta con tus propias palabras. Encierra lo que sabes y subraya lo que debes hallar.
Split the list at the median: lower half 5, 8, 12, 15 and upper half 20, 25, 30, 35. Q1 and Q3 are the medians of those halves.
Parte la lista en la mediana: mitad inferior 5, 8, 12, 15 y mitad superior 20, 25, 30, 35. Q1 y Q3 son las medianas de esas mitades.
Start here: The 9 values are already in order — that's step zero done for you. The middle (5th) value is your median.
Empieza aquí: Los 9 valores ya están ordenados: ese paso cero ya está hecho. El valor del medio (el 5.º) es tu mediana.
Complete the table.Completa la tabla.
👪 Encourage your student to show work on paper if a box feels tricky.👪 Animen a mostrar el trabajo en papel si una casilla se siente difícil.
| MeasureMedida | ValueValor |
|---|---|
| Data: 5, 8, 12, 15, 18, 20, 25, 30, 35Datos: 5, 8, 12, 15, 18, 20, 25, 30, 35 | |
| MinimumMínimo |
|
| Q1 (median of lower half: 5, 8, 12, 15)Q1 (mediana de la mitad inferior: 5, 8, 12, 15) |
|
| MedianMediana |
|
| Q3 (median of upper half: 20, 25, 30, 35)Q3 (mediana de la mitad superior: 20, 25, 30, 35) |
|
| MaximumMáximo |
|
| IQR (Q3 − Q1)RIC (Q3 − Q1) |
|
Answer key for families — compare, then talk about why.Clave de respuestas para la familia — comparen y hablen del porqué.
Not tried yet? Close this and give it one try first. A wrong first try still helps.¿Todavía no lo intentaron? Ciérrenla y hagan un intento primero. Un primer intento equivocado también ayuda.
Why:Por qué: With 9 ordered values, the 5th one is the median, 18, and the ends give the minimum 5 and the maximum 35. Each half holds 4 values, so the quartiles average the two middle numbers: Q1 = (8 + 12) ÷ 2 = 10 and Q3 = (25 + 30) ÷ 2 = 27.5, which makes IQR = 27.5 − 10 = 17.5.Con 9 valores ordenados, el quinto es la mediana, 18, y los extremos dan el mínimo 5 y el máximo 35. Cada mitad tiene 4 valores, así que los cuartiles promedian los dos números del medio: Q1 = (8 + 12) ÷ 2 = 10 y Q3 = (25 + 30) ÷ 2 = 27.5, lo que hace que IQR = 27.5 − 10 = 17.5.
Say the question in your own words. Circle what you know and underline what you need to find.
Explica la pregunta con tus propias palabras. Encierra lo que sabes y subraya lo que debes hallar.
For each team: Min = 1st value, Max = 9th, Median = 5th. Q1 = middle of the first four, Q3 = middle of the last four. Then IQR = Q3 − Q1.
Para cada equipo: Mín = 1.er valor, Máx = 9.º, Mediana = 5.º. Q1 = el medio de los primeros cuatro, Q3 = el medio de los últimos cuatro. Luego RIC = Q3 − Q1.
Start here: Both score lists are already ordered, 9 games each — so the 5th score is each team's median. That's your anchor point.
Empieza aquí: Ambas listas de puntajes ya están ordenadas, con 9 partidos cada una, así que el 5.º puntaje es la mediana de cada equipo. Ese es tu punto de anclaje.
Two basketball teams played 9 games each. Team A: 40, 42, 44, 46, 48, 50, 52, 54, 56. Team B: 30, 35, 40, 45, 48, 50, 55, 60, 65. Find the five-number summary and IQR for each team. Which team is more consistent? Which has a wider spread in the middle 50%?Dos equipos de baloncesto jugaron 9 partidos cada uno. Equipo A: 40, 42, 44, 46, 48, 50, 52, 54, 56. Equipo B: 30, 35, 40, 45, 48, 50, 55, 60, 65. Encuentra el resumen de cinco números y el RIC de cada equipo. ¿Cuál equipo es más consistente? ¿Cuál tiene mayor dispersión en el 50% central?
👪 A complete sentence with math vocabulary is the goal — not a perfect paragraph.👪 Una oración completa con vocabulario matemático es la meta — no un párrafo perfecto.
Answer key for families — compare, then talk about why.Clave de respuestas para la familia — comparen y hablen del porqué.
Not tried yet? Close this and give it one try first. A wrong first try still helps.¿Todavía no lo intentaron? Ciérrenla y hagan un intento primero. Un primer intento equivocado también ayuda.
Why:Por qué: Team A's summary is 40, 43, 48, 53, 56 with IQR = 53 − 43 = 10, and Team B's is 30, 37.5, 48, 57.5, 65 with IQR = 57.5 − 37.5 = 20. Both teams share a median of 48, but Team B's middle 50% spreads twice as far, so Team A is the more consistent team.El resumen del Equipo A es 40, 43, 48, 53, 56 con IQR = 53 − 43 = 10, y el del Equipo B es 30, 37.5, 48, 57.5, 65 con IQR = 57.5 − 37.5 = 20. Los dos equipos comparten una mediana de 48, pero el 50% central del Equipo B se extiende el doble, así que el Equipo A es el más consistente.
Say the question in your own words. Circle what you know and underline what you need to find.
Explica la pregunta con tus propias palabras. Encierra lo que sabes y subraya lo que debes hallar.
Every list holds 7 scores already in order, so the median is the 4th score and each half has 3 scores whose middle value becomes a quartile.
Cada lista tiene 7 puntajes ya ordenados, así que la mediana es el cuarto puntaje y cada mitad tiene 3 puntajes cuyo valor del medio se vuelve un cuartil.
Start here: A five-number summary reports the minimum, Q1, median, Q3, and maximum, so each card is really five separate values to check.
Empieza aquí: Un resumen de cinco números da el mínimo, Q1, la mediana, Q3 y el máximo, así que cada tarjeta son en realidad cinco valores distintos por revisar.
Match each team's ordered scores to its five-number summary (min, Q1, median, Q3, max).Une los puntajes ordenados de cada equipo con su resumen de cinco números (mín., Q1, mediana, Q3, máx.).
Answer key for families — compare, then talk about why.Clave de respuestas para la familia — comparen y hablen del porqué.
Not tried yet? Close this and give it one try first. A wrong first try still helps.¿Todavía no lo intentaron? Ciérrenla y hagan un intento primero. Un primer intento equivocado también ayuda.
Why:Por qué: Each team recorded 7 ordered scores, so the summary is the 1st, 2nd, 4th, 6th, and 7th values: the median is the 4th score and each quartile is the middle of a three-score half. That gives Hawks 5, 8, 15, 21, 27; Comets 10, 13, 20, 28, 33; Jets 2, 6, 14, 23, 30; and Suns 4, 7, 16, 25, 31.Cada equipo registró 7 puntajes ordenados, así que el resumen son los valores 1.º, 2.º, 4.º, 6.º y 7.º: la mediana es el cuarto puntaje y cada cuartil es el valor del medio de una mitad de tres puntajes. Eso da Hawks 5, 8, 15, 21, 27; Comets 10, 13, 20, 28, 33; Jets 2, 6, 14, 23, 30; y Suns 4, 7, 16, 25, 31.
Say the question in your own words. Circle what you know and underline what you need to find.
Explica la pregunta con tus propias palabras. Encierra lo que sabes y subraya lo que debes hallar.
Each quarter of the data is 25%. Count how many quarters sit between Q1 and Q3: Q1 to the median, then the median to Q3.
Cada cuarto de los datos es 25%. Cuenta cuántos cuartos hay entre Q1 y Q3: de Q1 a la mediana y de la mediana a Q3.
Start here: Quartiles cut the data into 4 equal parts — 'quart' like 'quarter.' Each part holds the same share of the data.
Empieza aquí: Los cuartiles cortan los datos en 4 partes iguales: 'cuart-' como 'cuarto'. Cada parte tiene la misma porción de los datos.
What percentage of data falls between Q1 and Q3 on a box plot?¿Qué porcentaje de los datos queda entre Q1 y Q3 en un diagrama de caja?
Answer key for families — compare, then talk about why.Clave de respuestas para la familia — comparen y hablen del porqué.
Not tried yet? Close this and give it one try first. A wrong first try still helps.¿Todavía no lo intentaron? Ciérrenla y hagan un intento primero. Un primer intento equivocado también ayuda.
Why:Por qué: The box in a box plot contains the middle 50% of the data (from Q1 to Q3).La caja de un diagrama de caja contiene el 50% central de los datos (de Q1 a Q3).
Say the question in your own words. Circle what you know and underline what you need to find.
Explica la pregunta con tus propias palabras. Encierra lo que sabes y subraya lo que debes hallar.
The minimum and maximum are the two ends of the ordered list; the median is the value sitting right in the middle.
El mínimo y el máximo son los dos extremos de la lista ordenada; la mediana es el valor que queda justo en medio.
Start here: A five-number summary always starts from a list arranged from least to greatest.
Empieza aquí: Un resumen de cinco números siempre empieza con una lista ordenada de menor a mayor.
The Hawks' points per quarter are 2, 4, 5, 7, 8, 10, 12. Resting on the scoreboard, what are the minimum, median, and maximum?Los puntos por cuarto de los Hawks son 2, 4, 5, 7, 8, 10, 12. Según el marcador, ¿cuáles son el mínimo, la mediana y el máximo?
Answer key for families — compare, then talk about why.Clave de respuestas para la familia — comparen y hablen del porqué.
Not tried yet? Close this and give it one try first. A wrong first try still helps.¿Todavía no lo intentaron? Ciérrenla y hagan un intento primero. Un primer intento equivocado también ayuda.
Why:Por qué: The data is already in order. The smallest value is 2 and the largest is 12. There are 7 values, so the median is the 4th value, which is 7.Los datos ya están ordenados. El valor más pequeño es 2 y el más grande es 12. Hay 7 valores, así que la mediana es el 4.º valor, que es 7.
Say the question in your own words. Circle what you know and underline what you need to find.
Explica la pregunta con tus propias palabras. Encierra lo que sabes y subraya lo que debes hallar.
Scan the list 14, 22, 8, 31, 17: find the maximum and the minimum, then subtract the min from the max.
Revisa la lista 14, 22, 8, 31, 17: halla el máximo y el mínimo, y luego resta el mínimo del máximo.
Start here: Range = how far the data stretches: the gap between the biggest and smallest values only. The middle values don't matter.
Empieza aquí: El rango es cuánto se extienden los datos: la diferencia entre el valor mayor y el menor. Los valores del medio no importan.
Find the range of: 14, 22, 8, 31, 17Halla el rango de: 14, 22, 8, 31, 17
Answer key for families — compare, then talk about why.Clave de respuestas para la familia — comparen y hablen del porqué.
Not tried yet? Close this and give it one try first. A wrong first try still helps.¿Todavía no lo intentaron? Ciérrenla y hagan un intento primero. Un primer intento equivocado también ayuda.
Why:Por qué: Range = max − min = 31 − 8 = 23.Rango = máximo − mínimo = 31 − 8 = 23.
Pick a game and play as a team. Nothing here is timed, and every game can be replayed as many times as you like. Escojan un juego y jueguen en equipo. Nada aquí tiene cronómetro, y pueden repetir cada juego cuantas veces quieran.
Choose ONE game. Quick Quiz practices this lesson; the other games review related skills. Play together or solo, without a timer. Elige UN juego. Reto rápido practica esta lección; los demás repasan temas relacionados. Juega acompañado o a solas, sin cronómetro.
Flip two cards to find each problem's twin answer. Fewer flips = sharper memory! Volteen dos tarjetas para encontrar la pareja de cada problema. ¡Menos vueltas = mejor memoria!
Matches: 0 / 4 · Flips: 0 Parejas: 0 / 4 · Vueltas: 0
🎉 All twins found! Can you beat your flip count on a rematch?¡Encontraron todas las parejas! ¿Pueden lograrlo con menos vueltas en la revancha?
Take turns — student answers one, then a family member answers the next. Watch for the trick statements! Por turnos: el estudiante responde una y luego un familiar responde la siguiente. ¡Cuidado con las trampas!
Tap a card, then tap the bin it belongs in. Talk it through before you tap! Toquen una tarjeta y luego el cesto al que pertenece. ¡Conversen antes de tocar!
Everyone votes and says WHY. Then tap to see what the math says — sometimes it is a tie! Todos votan y dicen POR QUÉ. Luego toquen para ver qué dicen las matemáticas: ¡a veces es empate!
🔎 What the math saysLo que dicen las matemáticas
Reinforce tonight's topic with a quick family game. You ask; your student decides! Refuercen el tema de hoy con un juego rápido en familia. ¡Ustedes preguntan; su estudiante decide!
🎮 Play together! Statistical questions expect many different answers from a group. 🎮 ¡Jueguen juntos! Las preguntas estadísticas esperan muchas respuestas diferentes de un grupo.
The bigger review game for tonight's lesson — sort, match and choose. A wrong answer gives a hint and lets your student try again. No timer. El juego de repaso más grande para la lección de hoy — clasificar, emparejar y elegir. Si se equivocan, reciben una pista y lo intentan otra vez. Sin cronómetro.
Explain one answer aloud or on paper: “I got ___ because ___. I checked by ___.” Include your strategy and units. Then you are done.Explica una respuesta en voz alta o en papel: “Obtuve ___ porque ___. Comprobé usando ___.” Incluye tu estrategia y las unidades. Después termina.
Name one strategy that helped, or one question to ask next time. You can stop here; no adult signature is needed.
Di una estrategia que te ayudó o una pregunta para la próxima vez. Puedes terminar aquí; no necesitas la firma de un adulto.
Answers save automatically on this device. Tap Check This Problem anytime. Las respuestas se guardan solas en este dispositivo. Toquen Revisar esta pregunta cuando quieran.
These extras are not required. Photos, recordings and reflections stay on this device. To send anything to Mr. Neft, use ClassDojo.Estos extras no son obligatorios. Las fotos, grabaciones y reflexiones quedan en este dispositivo. Para enviar algo al Sr. Neft, usa ClassDojo.
Saved on:Guardado el:
🔥 1-Night StreakRacha de 1 noche
Question draft (not sent):Borrador de pregunta (no enviado):
Family reflection:Reflexión familiar:
Student Work Photo:Foto del trabajo:
Student Voice Memo:Nota de voz del estudiante:
A personal record of practice for . Saved on this device; not submitted to the teacher.
Practice partner (optional)
Date
Use this as a photobooth for the work itself: point the camera at tonight's notebook page, the scratchpad or the whiteboard and take the picture — or pose holding it up. Choose a frame, add stickers, then download it, print it, or add it to your optional reflection. The photo is never uploaded; it stays on this device. Úsenla como cabina de fotos del trabajo: apunten la cámara a la página del cuaderno, al borrador o a la pizarra y tomen la foto, o posen sosteniéndola. Elijan un marco, agreguen calcomanías y luego descárguenla, imprímanla o agréguenla a la reflexión opcional. La foto nunca se sube a internet; se queda en este dispositivo.
Camera Ready!¡Cámara lista!
Tap “Start Camera” to photograph tonight’s work, or use “Upload Work” below. The photo stays on this device.Toca “Iniciar Cámara” para fotografiar el trabajo de hoy, o usa “Subir Foto”. La foto se queda en este dispositivo.
Holding your open notebook or paper up next to your smile makes the best shot! You can also snap a photo of just your written work. ¡Sostener el cuaderno abierto junto a su sonrisa crea la mejor foto! También pueden tomar la foto solo de su trabajo escrito.
A box plot locates the five-number summary on one consistent scale.
Un diagrama de caja coloca el resumen de cinco números en una escala uniforme.
Order these six book lengths: 2, 4, 6, 8, 10, 12.
Ordena estas seis longitudes de libros: 2, 4, 6, 8, 10, 12.
Find minimum 2, Q1 4, median 7, Q3 10, and maximum 12.
Halla mínimo 2, Q1 4, mediana 7, Q3 10 y máximo 12.
Use a rule before checking what this question asks.
Usa una regla sin revisar qué pide esta pregunta.
These links go to specific videos and lessons about tonight's topic — not general math pages. Estos enlaces van a videos y lecciones específicas sobre el tema de hoy — no páginas generales.