Unit 2 · Standard 6.DS.5
🔑 Represent and Describe Data in a Box Plot — Vocab Explorer
① Word Wall
Look at the picture, read the meaning, and tap 🔊 to hear each word.
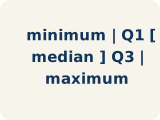
ES Representar datos con diagramas de caja
Show a data set's five-number summary in a box-and-whisker display.
Mostrar el resumen de cinco números de un conjunto de datos en un diagrama de caja y bigotes.

ES Diagrama de caja
A graph that shows how data is spread using five key numbers.
Una gráfica que muestra cómo se reparten los datos con cinco números clave.

ES Mediana
The middle number when you put them in order.
El número del medio cuando los pones en orden.

ES Cuartil
Numbers that split the data into four equal parts.
Números que dividen los datos en cuatro partes iguales.

ES Rango intercuartílico
The spread of the middle half of the data (Q3 − Q1).
La extensión de la mitad central de los datos (Q3 − Q1).

ES Distribución de datos
How the data looks: where it sits and how spread out it is.
Cómo se ven los datos: dónde están y qué tan separados están.

ES Variabilidad
How spread out the numbers are.
Qué tan separados están los números.
ES Resumen de cinco números
The minimum, first quartile, median, third quartile, and maximum of a data set.
El mínimo, el primer cuartil, la mediana, el tercer cuartil y el máximo de un conjunto de datos.
ES Bigote
A line on a box plot that reaches from the box out to the least or greatest value.
Una línea en un diagrama de caja que va desde la caja hasta el valor menor o mayor.
ES Mitad central
The values from the first quartile to the third quartile, which the box covers.
Los valores desde el primer cuartil hasta el tercer cuartil, que la caja cubre.
② Match it
Tap a word, then tap its meaning.
③ Fill in the blank
Use the word bank to finish each sentence.
- 1A box plot shows the -number summary: least, Q1, median, Q3, greatest.
- 2A graph that shows data with a box and whiskers based on the five-number summary is a .
- 3The middle value of the data, shown as a line inside the box, is the .
- 4A value that divides the data into four equal parts is a .
- 5The distance between the first and third quartiles, showing the middle 50% of data, is the .
- 6The way data values are spread out is the .
- 7How spread out the data values are is the .
- 8The minimum, Q1, median, Q3, and maximum together are the .
- 9The line that reaches from the box to an extreme value is a .
- 10The box of a box plot covers the of the data.
④ Use it in a sentence
Pick one word and finish the sentence in your own words.
A is .