Learn It
What is the mean absolute deviation (MAD)?
The mean absolute deviation, or MAD, is the average distance of each value from the mean. It tells you how spread out the data is: a small MAD means the data is close together, and a large MAD means it is spread out.
Picture itSee what the math looks like before you read about it
Watch me solve itI do — read one step at a time
- My data set: 6, 8, 10, 12. First I find the : 6 + 8 + 10 + 12 = 36, then 36 ÷ 4 = 9. The mean is 9.6 + 8 + 10 + 12 = 36
- Next I find each (value − ): 6−9 = −3, 8−9 = −1, 10−9 = 1, 12−9 = 3.
- Then I take the of each (the distance, never negative (zero is allowed)): 3, 1, 1, 3.
- Finally I average those distances: 3 + 1 + 1 + 3 = 8, then 8 ÷ 4 = 2. So the MAD = 2 points.3 + 1 + 1 + 3 = 8
Watch out — mistakes students make here
- Distances aren't all zero — find each value's gap from 6.
- 6 is the mean — MAD averages the DISTANCES from the mean.
- Bigger MAD means times vary more, not faster potential.
Try it with meWe do — you answer first, then check
Same steps, new numbers.
- New data set: 9, 10, 11. First, what is the ?
Check this step
Add the three numbers and divide by 3. - Now find how far each number is from the . What is the distance for 9?
Check this step
For 10? For 11? - Add those distances and divide by 3. Is this MAD small or large?
Check this step
What does that tell us about the ?
On your ownYou do — solve this one by yourself
Before you start, remember:
- Remember: first, then , then average.
Solve: Two runners have the same average time of 60 seconds. Runner A's MAD is 1.2 seconds. Runner B's MAD is 5.8 seconds. Which runner is the coach more likely to pick for a relay race that needs a reliable time?
My answer
Stuck? Open one hint at a time.
Hint 1
'Reliable' is the key word — the coach wants times that barely change from race to race, not just a good average.
Hint 2
Both runners average 60 seconds, so the average can't decide this. MAD tells you how much each runner's times swing around 60.
Hint 3
Read each MAD as an average distance: for Runner A, the recorded times are an average of 1.2 seconds away from the mean of 60 seconds. Compare that with 5.8 seconds for Runner B.
Check my answer
Runner A's MAD of 1.2 seconds means the average distance of the recorded times from the 60-second mean is 1.2 seconds. Runner B has a larger average distance from the same mean, so A was more consistent in these data. MAD does not guarantee how many times fall within 1.2 seconds of the mean.
Turn & TalkSay it out loud with a partner
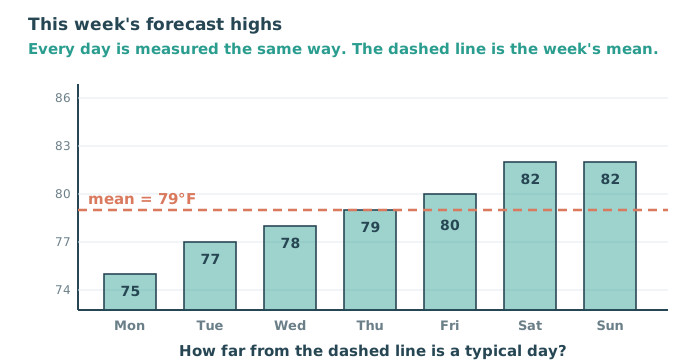
The forecast shows seven high temperatures and their is 79°F. Which day is farthest from the mean, and what does that tell you about the week?
Try starting with:
- I think ___ because ___.Pienso que ___ porque ___.
- I agree / disagree with you because ___.Estoy / no estoy de acuerdo contigo porque ___.