Unit 9 · Standard 6.AT.11
🔑 Analyze Graphs of Relationships Between Two Variables — Vocab Explorer
① Word Wall
Look at the picture, read the meaning, and tap 🔊 to hear each word.

ES gráfica
A picture on a coordinate plane that shows how two quantities are related.
Un dibujo en un plano de coordenadas que muestra cómo se relacionan dos cantidades.
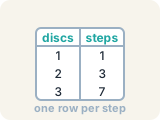
ES tabla de valores
A list of matched pairs of values that shows a relationship using numbers.
Una lista de pares de valores que muestra una relación usando números.

ES par ordenado
Two numbers written as (x, y) that name one point on a graph. The independent variable comes first.
Dos números escritos como (x, y) que nombran un punto en la gráfica. La variable independiente va primero.

ES eje
One of the two number lines that frame a graph. Each axis is labeled with a quantity from the problem.
Una de las dos rectas numéricas que enmarcan una gráfica. Cada eje se rotula con una cantidad del problema.
ES coordenadas
The numbers in an ordered pair that tell how far to move along each axis to reach a point.
Los números de un par ordenado que indican cuánto avanzar por cada eje para llegar a un punto.

ES Tasa de cambio
How much y changes each time x goes up by one.
Cuánto cambia y cada vez que x aumenta en uno.

ES Origen
The point (0, 0) where the two axes meet.
El punto (0, 0) donde se cruzan los dos ejes.
② Match it
Tap a word, then tap its meaning.
③ Fill in the blank
Use the word bank to finish each sentence.
- 1A picture on the coordinate plane showing how two quantities relate is a .
- 2A list of matched pairs that shows a relationship in numbers is a .
- 3Two numbers written (x, y) that name one point are an .
- 4Each number line framing a graph, labeled with a quantity, is an .
- 5The numbers in an ordered pair that tell how far to move are its .
- 6How much y changes when x goes up by one is the .
- 7The point (0, 0) where the axes meet is the .
④ Use it in a sentence
Pick one word and finish the sentence in your own words.
A is .