Touch and changeToca y cambia
Move, type, tap, or drag in the model. Watch what changes.Mueve, escribe, toca o arrastra en el modelo. Observa qué cambia.
Unit 2 · Understanding the World Around Us Through Statistics Unidad 2 · Entender el mundo que nos rodea con la estadística
Represent and Describe Data in a HistogramRepresentar y describir datos en un histograma
6.DS.5 ▾This lesson builds proficiency in Grade 6 mathematical standard 6.DS.5.Esta lección desarrolla destrezas en el estándar matemático de 6.º grado 6.DS.5.
Optional, ungraded practice. Work with someone or on your own; no adult signature is needed. Práctica opcional, sin calificación. Trabaja con alguien o a solas; no necesitas la firma de un adulto.
All practice is optional and ungraded. Choose the time that works for your family; your route choice is saved on this device.Toda la práctica es opcional y no lleva calificación. Elijan el tiempo que les funcione; la ruta queda guardada en este dispositivo.
Family Math Studio selected: 6 problems, key words, one home mission, and one math game. Go at your own pace. Estudio familiar seleccionado: 6 problemas, palabras clave, una misión en casa y un juego de matemáticas. Avancen a su ritmo.
💡 Draw fraction bars, tape diagrams, equations, or line up decimals together!💡 ¡Dibujen barras de fracciones, modelos o alineen decimales juntos!
Tonight we make a histogram: a bar graph that groups numbers into equal ranges so a big set of data is easy to read.
Esta noche hacemos un histograma: una gráfica de barras que agrupa números en rangos iguales para que un conjunto grande de datos sea fácil de leer.
For the grown-up helping tonightPara el adulto que ayuda hoy
0–2: 3; 3–5: 2; 6–8: 1
Real example, the data 3, 7, 12, 15, 18, 24.
Ejemplo real, los datos 3, 7, 12, 15, 18, 24.
We use intervals of 10: 0–9, 10–19, 20–29.
Usamos intervalos de 10: 0–9, 10–19, 20–29.
Interval 0–9: the values 3 and 7 fit, so the frequency is 2.
Intervalo 0–9: los valores 3 y 7 caen ahí, así que la frecuencia es 2.
Interval 10–19: the values 12, 15, and 18 fit, so the frequency is 3.
Intervalo 10–19: los valores 12, 15 y 18 caen ahí, así que la frecuencia es 3.
Interval 20–29: only 24 fits, so the frequency is 1.
Intervalo 20–29: solo 24 cae ahí, así que la frecuencia es 1.
Draw three bars with heights 2, 3, and 1, touching each other.
Dibuja tres barras con alturas 2, 3 y 1, que se tocan entre sí.
The tallest bar (10–19) shows where most values are.
La barra más alta (10–19) muestra dónde están la mayoría de los valores.
Listen for "frecuencia" — it means how many values fall inside one interval (the bar's height).
Escucha "frecuencia" — significa cuántos valores caen dentro de un intervalo (la altura de la barra).
Listen for "intervalo" — it is a range of numbers, like 0–9 or 10–19, used to group the data.
Escucha "intervalo" — es un rango de números, como 0–9 o 10–19, para agrupar los datos.
Remind your student: in a histogram the bars touch, because the intervals are side by side with no gaps.
Recuérdale a tu estudiante: en un histograma las barras se tocan, porque los intervalos están uno al lado del otro sin huecos.
Change the numbers. Explain what the picture shows.Cambia los números. Explica qué muestra el dibujo.
🌐 Esta herramienta interactiva por ahora solo está en inglés. Para qué sirve: Agrupa datos en intervalos y sube cada barra a su cantidad, así el histograma es algo que construyes y no solo que lees. Usen los pasos en español de esta tarjeta para guiarse.
Move, type, tap, or drag in the model. Watch what changes.Mueve, escribe, toca o arrastra en el modelo. Observa qué cambia.
Record one equation, value, or relationship you can see.Escribe una ecuación, un valor o una relación que puedas ver.
I notice ___ changes when ___ changes. This shows ___.Noto que ___ cambia cuando ___ cambia. Esto muestra ___.
Ask: "Where do you see the numbers from tonight's math in this model?"Pregunta: "¿Dónde ves los números de la tarea de hoy en este modelo?"
Use these page counts: 1, 2, 2, 4, 5, 7. Draw intervals 0–2, 3–5, and 6–8. Usa estas cantidades de páginas: 1, 2, 2, 4, 5, 7. Dibuja intervalos 0–2, 3–5 y 6–8.
Using a familiar rule before identifying what this question asks. Usar una regla conocida sin identificar qué pide esta pregunta.
1. Tap a card to flip it. 2. Play the quiz. 3. Match the words. 1. Toca una tarjeta para voltearla. 2. Juega el quiz. 3. Empareja las palabras.
Representar datos con histogramas
Representar datos con histogramas
Group numerical data into intervals and show each interval's frequency with a bar.
ES Agrupar datos numéricos en intervalos y mostrar la frecuencia de cada intervalo con una barra.
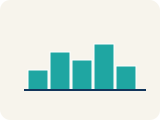
Histograma
Histograma
A bar graph that groups data into equal ranges. The bars touch.
ES Una gráfica de barras que agrupa datos en rangos iguales. Las barras se tocan.
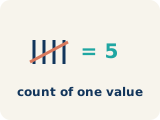
Frecuencia
Frecuencia
How many times a value shows up.
ES Cuántas veces aparece un valor.
Intervalo
Intervalo
A range of numbers used to group data.
ES Un rango de números para agrupar datos.
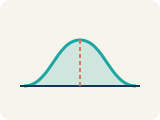
Distribución
Distribución
How the data is spread out.
ES Cómo están repartidos los datos.
Variabilidad
Variabilidad
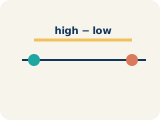
How spread out the numbers are.
ES Qué tan separados están los números.
Tabla de frecuencias
Tabla de frecuencias
A table that lists each interval and how many values fall in it.
ES Una tabla que muestra cada intervalo y cuántos valores caen en él.
Forma de los datos
Forma de los datos
The pattern the bars or dots make across the intervals.
ES El patrón que forman las barras o los puntos a lo largo de los intervalos.
Pico
Pico
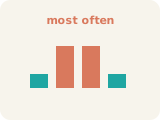
The tallest bar or stack in a data display.
ES La barra o pila más alta en una representación de datos.
Which word fits?¿Qué palabra encaja?
🎉 Quiz done!¡Quiz terminado!
First-try stars:Estrellas al primer intento:
Tap a word on the left, then tap its matching definition on the right! ¡Toca una palabra a la izquierda y su significado a la derecha!
Complete the 6 problems below. The extra practice at the bottom is optional. Completa los 6 problemas de abajo. La práctica extra al final es opcional.
A few problems to practice together. Each one has a step-by-step guide, a picture to draw on, and a space to show your work. Use Check This Problem for instant feedback — no need to finish everything at once. Unos problemas para practicar juntos. Cada uno tiene una guía paso a paso, un dibujo para trabajar y un espacio para mostrar el trabajo. Usen Revisar esta pregunta para retroalimentación al instante — no tienen que terminar todo de una vez.
Easier problems to practice the idea. Do these first together. Problemas más fáciles para practicar la idea. Hagan estos primero juntos.
Say the question in your own words. Circle what you know and underline what you need to find.
Explica la pregunta con tus propias palabras. Encierra lo que sabes y subraya lo que debes hallar.
Histogram bars always touch because the data ranges are continuous.
Las barras del histograma siempre se tocan porque los rangos de datos son continuos.
Start here: You must decide on intervals before counting data in each one.
Empieza aquí: Debes decidir los intervalos antes de contar los datos de cada uno.
Order the steps for making a histogram.Ordena los pasos para hacer un histograma.
👪 On a phone, use Move to. On a computer, drag cards or tap a card then tap a column.👪 En el teléfono usen Mover a. En la computadora arrastren o toquen tarjeta y columna.
💡 You must decide on intervals before counting data in each one.Debes decidir los intervalos antes de contar los datos de cada uno.
💡 Histogram bars always touch because the data ranges are continuous.Las barras del histograma siempre se tocan porque los rangos de datos son continuos.
Answer key for families — compare, then talk about why.Clave de respuestas para la familia — comparen y hablen del porqué.
Not tried yet? Close this and give it one try first. A wrong first try still helps.¿Todavía no lo intentaron? Ciérrenla y hagan un intento primero. Un primer intento equivocado también ayuda.
Why:Por qué: The order is: choose equal-sized intervals, count the frequency in each one, draw bars whose heights match those frequencies, then make sure the bars touch. Counting cannot happen until the intervals exist, and the bar heights cannot be drawn until you know the counts.El orden es: elegir intervalos del mismo tamaño, contar la frecuencia en cada uno, dibujar barras cuyas alturas sean esas frecuencias y luego asegurarte de que las barras se toquen. No puedes contar antes de tener los intervalos, y no puedes dibujar las alturas antes de conocer los conteos.
Say the question in your own words. Circle what you know and underline what you need to find.
Explica la pregunta con tus propias palabras. Encierra lo que sabes y subraya lo que debes hallar.
Ask each term a question: does it answer 'how many?', 'which values are grouped?', or 'why are there no gaps?'
Hazle una pregunta a cada término: ¿responde '¿cuántos?', '¿qué valores se agrupan?' o '¿por qué no hay huecos?'
Start here: Three vocab cards: one is a count, one is a range of values, and one explains the histogram's no-gap look.
Empieza aquí: Tres tarjetas de vocabulario: una es un conteo, otra es un rango de valores y otra explica por qué el histograma no tiene huecos.
Match each word to what it means on a histogram.Une cada palabra con lo que significa en un histograma.
👪 Say each term out loud, then talk through which match makes sense before choosing.👪 Digan cada término en voz alta y hablen de cuál pareja tiene sentido antes de elegir.
Answer key for families — compare, then talk about why.Clave de respuestas para la familia — comparen y hablen del porqué.
Not tried yet? Close this and give it one try first. A wrong first try still helps.¿Todavía no lo intentaron? Ciérrenla y hagan un intento primero. Un primer intento equivocado también ayuda.
Why:Por qué: Frequency answers 'how many?', so it pairs with the count of values in an interval — that count is the bar's height. Interval is a range like 10–19 that groups values together, and 'Bars touch' explains why a histogram has no gaps: the intervals run right into each other with no numbers left out.Frecuencia responde «¿cuántos?», así que se empareja con el conteo de valores en un intervalo, y ese conteo es la altura de la barra. Intervalo es un rango como 10–19 que agrupa valores, y «Las barras se tocan» explica por qué un histograma no tiene huecos: los intervalos se continúan uno con otro sin dejar ningún número fuera.
Say the question in your own words. Circle what you know and underline what you need to find.
Explica la pregunta con tus propias palabras. Encierra lo que sabes y subraya lo que debes hallar.
Key difference: histograms group numbers into touching intervals; bar graphs show separate categories with gaps between bars.
Diferencia clave: los histogramas agrupan números en intervalos que se tocan; las gráficas de barras muestran categorías separadas con huecos entre las barras.
Start here: Two cards are graph types (compare their bars) and two are parts of a histogram (a count and a range).
Empieza aquí: Dos tarjetas son tipos de gráfica (compara sus barras) y dos son partes de un histograma (un conteo y un rango).
Match each term to its description.Une cada término con su descripción.
Answer key for families — compare, then talk about why.Clave de respuestas para la familia — comparen y hablen del porqué.
Not tried yet? Close this and give it one try first. A wrong first try still helps.¿Todavía no lo intentaron? Ciérrenla y hagan un intento primero. Un primer intento equivocado también ayuda.
Why:Por qué: Histogram goes with 'bars touch, shows frequency by interval' and Bar graph with 'bars separated, shows categories' — the gap between bars is the visual clue that separates the two graph types. Frequency is the count of values in an interval, and Interval is the range of values grouped together.Histograma va con «las barras se tocan, muestra la frecuencia por intervalo» y Gráfica de barras con «las barras están separadas, muestra categorías»: el espacio entre barras es la pista visual que distingue los dos tipos de gráfica. Frecuencia es el conteo de valores en un intervalo, e Intervalo es el rango de valores que se agrupan.
Try these once the warm-up feels easy. It's okay to use the steps and pictures. Intenten estos cuando el calentamiento sea fácil. Está bien usar los pasos y los dibujos.
Say the question in your own words. Circle what you know and underline what you need to find.
Explica la pregunta con tus propias palabras. Encierra lo que sabes y subraya lo que debes hallar.
Reason it out: covering the same score range with narrower buckets requires MORE buckets. Then ask what having more bars does for detail.
Razónalo: cubrir el mismo rango de puntajes con intervalos más angostos requiere MÁS intervalos. Luego pregunta qué logra tener más barras para el detalle.
Start here: Both histograms use all 40 scores — the only difference is bucket width: 5 points vs 20 points per interval.
Empieza aquí: Ambos histogramas usan los 40 puntajes: la única diferencia es el ancho del intervalo, 5 puntos frente a 20 puntos.
Two histograms show the SAME 40 test scores — one uses intervals of 5, the other intervals of 20. Which statement is true?Dos histogramas muestran los MISMOS 40 puntajes: uno usa intervalos de 5 y el otro intervalos de 20. ¿Qué afirmación es verdadera?
👪 Read the question together, then let your student pick an answer before you discuss why.👪 Lean la pregunta juntos; dejen que su estudiante elija antes de hablar del porqué.
Answer key for families — compare, then talk about why.Clave de respuestas para la familia — comparen y hablen del porqué.
Not tried yet? Close this and give it one try first. A wrong first try still helps.¿Todavía no lo intentaron? Ciérrenla y hagan un intento primero. Un primer intento equivocado también ayuda.
Why:Por qué: Smaller intervals create more bars and reveal finer detail; larger intervals smooth the shape into fewer bars. Both still include all 40 scores.Los intervalos más pequeños crean más barras y revelan detalles más finos; los intervalos más grandes suavizan la forma en menos barras. Ambos histogramas siguen incluyendo los 40 puntajes.
Say the question in your own words. Circle what you know and underline what you need to find.
Explica la pregunta con tus propias palabras. Encierra lo que sabes y subraya lo que debes hallar.
Compare three things: how many bars each histogram has, how tall its bars get, and how clearly you can see the shape, peaks, or gaps.
Compara tres cosas: cuántas barras tiene cada histograma, qué tan altas llegan y qué tan claro se ve la forma, los picos o los huecos.
Start here: Same data, two bucket sizes. Think: chopping scores into many small buckets vs a few big buckets — what changes about the picture?
Empieza aquí: Los mismos datos con dos tamaños de intervalo. Piensa: partir los puntajes en muchos grupos pequeños frente a pocos grupos grandes, ¿qué cambia en la imagen?
A teacher collected test scores and made two different histograms — one with intervals of 5 (50–54, 55–59, etc.) and one with intervals of 20 (50–69, 70–89, 90–109). Both use the same data. How might the two histograms look different? Which interval size gives you more detail about the distribution? When might the larger interval be better?Un maestro recopiló puntajes de exámenes e hizo dos histogramas distintos: uno con intervalos de 5 (50–54, 55–59, etc.) y otro con intervalos de 20 (50–69, 70–89, 90–109). Los dos usan los mismos datos. ¿En qué podrían verse diferentes los dos histogramas? ¿Cuál tamaño de intervalo te da más detalle sobre la distribución? ¿Cuándo podría convenir más el intervalo grande?
👪 A complete sentence with math vocabulary is the goal — not a perfect paragraph.👪 Una oración completa con vocabulario matemático es la meta — no un párrafo perfecto.
Answer key for families — compare, then talk about why.Clave de respuestas para la familia — comparen y hablen del porqué.
Not tried yet? Close this and give it one try first. A wrong first try still helps.¿Todavía no lo intentaron? Ciérrenla y hagan un intento primero. Un primer intento equivocado también ayuda.
Why:Por qué: Intervals of 5 across 50–109 make 12 narrow bars with small frequencies, so peaks, gaps, and the exact shape show up clearly. Intervals of 20 make only 3 tall bars that smooth those details away, which is useful when the data set is large or you only want the big-picture comparison of low, middle, and high scores.Intervalos de 5 a lo largo de 50–109 forman 12 barras angostas con frecuencias pequeñas, así que los picos, los huecos y la forma exacta se ven con claridad. Intervalos de 20 forman solo 3 barras altas que borran esos detalles, lo cual sirve cuando el conjunto de datos es grande o solo quieres la comparación general entre calificaciones bajas, medias y altas.
Say the question in your own words. Circle what you know and underline what you need to find.
Explica la pregunta con tus propias palabras. Encierra lo que sabes y subraya lo que debes hallar.
Go through the list in order and mark only the numbers that are at least 10 and no more than 19.
Recorre la lista en orden y marca solo los números que sean al menos 10 y no más de 19.
Start here: A frequency is just a count of how many values land inside one interval, endpoints included.
Empieza aquí: Una frecuencia es simplemente el conteo de cuántos valores caen dentro de un intervalo, incluyendo los extremos.
Data: 4, 8, 9, 12, 14, 15, 17, 18, 19, 22, 24, 27, 31, 33. How many values fall in the 10–19 interval?Datos: 4, 8, 9, 12, 14, 15, 17, 18, 19, 22, 24, 27, 31, 33. ¿Cuántos valores caen en el intervalo 10–19?
Answer key for families — compare, then talk about why.Clave de respuestas para la familia — comparen y hablen del porqué.
Not tried yet? Close this and give it one try first. A wrong first try still helps.¿Todavía no lo intentaron? Ciérrenla y hagan un intento primero. Un primer intento equivocado también ayuda.
Why:Por qué: The values 12, 14, 15, 17, 18, and 19 all fall between 10 and 19, so the frequency for that bin is 6.Los valores 12, 14, 15, 17, 18 y 19 caen entre 10 y 19, así que la frecuencia de ese intervalo es 6.
Optional. Only if your student wants more — these are bonus problems. Opcional. Solo si tu estudiante quiere más — son problemas adicionales.
Say the question in your own words. Circle what you know and underline what you need to find.
Explica la pregunta con tus propias palabras. Encierra lo que sabes y subraya lo que debes hallar.
Think about the x-axis: categories like 'red, blue, green' can be separated, but number intervals like 0–9 and 10–19 connect end to end.
Piensa en el eje x: categorías como 'rojo, azul, verde' se pueden separar, pero intervalos numéricos como 0–9 y 10–19 se conectan de punta a punta.
Start here: Picture both graphs side by side: one has spaces between its bars, one doesn't. Ask why that would be.
Empieza aquí: Imagina las dos gráficas lado a lado: una tiene espacios entre las barras y la otra no. Pregunta por qué sería así.
How is a histogram different from a regular bar graph?¿En qué se diferencia un histograma de una gráfica de barras común?
Answer key for families — compare, then talk about why.Clave de respuestas para la familia — comparen y hablen del porqué.
Not tried yet? Close this and give it one try first. A wrong first try still helps.¿Todavía no lo intentaron? Ciérrenla y hagan un intento primero. Un primer intento equivocado también ayuda.
Why:Por qué: In a histogram, bars touch because each interval connects to the next (0–9, 10–19, etc.) — the data is continuous.En un histograma las barras se tocan porque cada intervalo se conecta con el siguiente (0–9, 10–19, etc.): los datos son continuos.
Say the question in your own words. Circle what you know and underline what you need to find.
Explica la pregunta con tus propias palabras. Encierra lo que sabes y subraya lo que debes hallar.
Height is a COUNT, not a calculation — no averaging, no middle values. Ask which choice simply says 'how many.'
La altura es un CONTEO, no un cálculo: sin promedios ni valores del medio. Pregunta qué opción simplemente dice 'cuántos'.
Start here: Think about what you'd count to draw one bar: you'd tally how many data values land inside that interval.
Empieza aquí: Piensa qué contarías para dibujar una barra: contarías cuántos datos caen dentro de ese intervalo.
In a histogram, what does the height of each bar represent?En un histograma, ¿qué representa la altura de cada barra?
Answer key for families — compare, then talk about why.Clave de respuestas para la familia — comparen y hablen del porqué.
Not tried yet? Close this and give it one try first. A wrong first try still helps.¿Todavía no lo intentaron? Ciérrenla y hagan un intento primero. Un primer intento equivocado también ayuda.
Why:Por qué: Each bar's height shows the frequency — how many data values fall within that interval.La altura de cada barra muestra la frecuencia: cuántos valores de datos caen dentro de ese intervalo.
Say the question in your own words. Circle what you know and underline what you need to find.
Explica la pregunta con tus propias palabras. Encierra lo que sabes y subraya lo que debes hallar.
A bar's height always answers 'how many data values landed here?' Ask yourself what the 7 is counting.
La altura de una barra siempre responde '¿cuántos datos cayeron aquí?' Pregúntate qué está contando el 7.
Start here: Two numbers appear here: the interval (20–29) and the height (7). Keep straight which one is a range and which is a count.
Empieza aquí: Aquí aparecen dos números: el intervalo (20–29) y la altura (7). Ten claro cuál es un rango y cuál es un conteo.
A histogram bar for the interval 20–29 reaches a height of 7. What does the 7 tell you?En un histograma, la barra del intervalo 20–29 llega a una altura de 7. ¿Qué te dice el 7?
Answer key for families — compare, then talk about why.Clave de respuestas para la familia — comparen y hablen del porqué.
Not tried yet? Close this and give it one try first. A wrong first try still helps.¿Todavía no lo intentaron? Ciérrenla y hagan un intento primero. Un primer intento equivocado también ayuda.
Why:Por qué: A bar's height is the frequency — here, 7 values land in the 20–29 interval.La altura de una barra es la frecuencia: aquí, 7 valores caen en el intervalo 20–29.
Say the question in your own words. Circle what you know and underline what you need to find.
Explica la pregunta con tus propias palabras. Encierra lo que sabes y subraya lo que debes hallar.
Work interval by interval: for 0–4, count the values from 0 through 4. Repeat for 5–9, 10–14, and 15–19. All four counts should add to 12.
Trabaja intervalo por intervalo: para 0–4, cuenta los valores de 0 a 4. Repite con 5–9, 10–14 y 15–19. Las cuatro cuentas deben sumar 12.
Start here: The 12 rebound values are already listed in order: 1, 3, 4, 6, ... 16. Each value fits exactly one interval.
Empieza aquí: Los 12 valores de rebotes ya están en orden: 1, 3, 4, 6, ... 16. Cada valor cae en exactamente un intervalo.
Use this data set of rebounds per game to complete the frequency table (intervals of 5): 1, 3, 4, 6, 7, 8, 9, 11, 12, 13, 14, 16.Usa este conjunto de datos de rebotes por partido para completar la tabla de frecuencias (intervalos de 5): 1, 3, 4, 6, 7, 8, 9, 11, 12, 13, 14, 16.
👪 Encourage your student to show work on paper if a box feels tricky.👪 Animen a mostrar el trabajo en papel si una casilla se siente difícil.
| Interval (Rebounds)Intervalo (rebotes) | FrequencyFrecuencia |
|---|---|
| 0–4 |
|
| 5–9 |
|
| 10–14 |
|
| 15–19 |
|
Answer key for families — compare, then talk about why.Clave de respuestas para la familia — comparen y hablen del porqué.
Not tried yet? Close this and give it one try first. A wrong first try still helps.¿Todavía no lo intentaron? Ciérrenla y hagan un intento primero. Un primer intento equivocado también ayuda.
Why:Por qué: With intervals of 5, the values 1, 3, 4 fall in 0–4 (3), the values 6, 7, 8, 9 fall in 5–9 (4), the values 11, 12, 13, 14 fall in 10–14 (4), and only 16 falls in 15–19 (1). The frequencies 3 + 4 + 4 + 1 = 12, matching the 12 rebound values.Con intervalos de 5, los valores 1, 3, 4 caen en 0–4 (3), los valores 6, 7, 8, 9 caen en 5–9 (4), los valores 11, 12, 13, 14 caen en 10–14 (4) y solo el 16 cae en 15–19 (1). Las frecuencias 3 + 4 + 4 + 1 = 12, igual a los 12 valores de rebotes.
Say the question in your own words. Circle what you know and underline what you need to find.
Explica la pregunta con tus propias palabras. Encierra lo que sabes y subraya lo que debes hallar.
Each frequency counts the players in one interval, and no player is counted twice — so combine all four frequencies into one total.
Cada frecuencia cuenta los jugadores de un intervalo, y ningún jugador se cuenta dos veces, así que combina las cuatro frecuencias en un solo total.
Start here: The question asks for the TOTAL across all four intervals — not the tallest bar and not the biggest interval.
Empieza aquí: La pregunta pide el TOTAL de los cuatro intervalos, no la barra más alta ni el intervalo más grande.
A histogram shows these frequencies: 0–4: 3 players, 5–9: 8 players, 10–14: 12 players, 15–19: 5 players. How many players are represented in total?Un histograma muestra estas frecuencias: 0–4: 3 jugadores, 5–9: 8 jugadores, 10–14: 12 jugadores, 15–19: 5 jugadores. ¿Cuántos jugadores se representan en total?
Answer key for families — compare, then talk about why.Clave de respuestas para la familia — comparen y hablen del porqué.
Not tried yet? Close this and give it one try first. A wrong first try still helps.¿Todavía no lo intentaron? Ciérrenla y hagan un intento primero. Un primer intento equivocado también ayuda.
Why:Por qué: Add all frequencies: 3 + 8 + 12 + 5 = 28 players.Suma todas las frecuencias: 3 + 8 + 12 + 5 = 28 jugadores.
Say the question in your own words. Circle what you know and underline what you need to find.
Explica la pregunta con tus propias palabras. Encierra lo que sabes y subraya lo que debes hallar.
Find the team size by adding the frequencies of all the bars together.
Halla el tamaño del equipo sumando las frecuencias de todas las barras.
Start here: Every player in the data set is counted in exactly one bar, so no one is left out and no one is doubled.
Empieza aquí: Cada jugador del conjunto de datos se cuenta en exactamente una barra, así que nadie queda fuera ni se cuenta dos veces.
Read this histogram of assists per game — 0–4: 2 players, 5–9: 8 players, 10–14: 5 players, 15–19: 1 player. About how many players are on the team?Lee este histograma de asistencias por partido: 0–4: 2 jugadores, 5–9: 8 jugadores, 10–14: 5 jugadores, 15–19: 1 jugador. ¿Aproximadamente cuántos jugadores hay en el equipo?
Answer key for families — compare, then talk about why.Clave de respuestas para la familia — comparen y hablen del porqué.
Not tried yet? Close this and give it one try first. A wrong first try still helps.¿Todavía no lo intentaron? Ciérrenla y hagan un intento primero. Un primer intento equivocado también ayuda.
Why:Por qué: Add every bar's frequency: 2 + 8 + 5 + 1 = 16 players total.Suma la frecuencia de cada barra: 2 + 8 + 5 + 1 = 16 jugadores en total.
Say the question in your own words. Circle what you know and underline what you need to find.
Explica la pregunta con tus propias palabras. Encierra lo que sabes y subraya lo que debes hallar.
List the values in the first interval, 0–4: count every whole number from 0 up to and including 4.
Enumera los valores del primer intervalo, 0–4: cuenta cada número entero desde 0 hasta 4 inclusive.
Start here: Width means how many whole-number values fit inside one interval — count them, don't just subtract the endpoints.
Empieza aquí: El ancho significa cuántos valores enteros caben dentro de un intervalo — cuéntalos, no solo restes los extremos.
A histogram has intervals: 0–4, 5–9, 10–14, 15–19. What is the width of each interval?Un histograma tiene los intervalos: 0–4, 5–9, 10–14, 15–19. ¿Cuál es el ancho de cada intervalo?
Answer key for families — compare, then talk about why.Clave de respuestas para la familia — comparen y hablen del porqué.
Not tried yet? Close this and give it one try first. A wrong first try still helps.¿Todavía no lo intentaron? Ciérrenla y hagan un intento primero. Un primer intento equivocado también ayuda.
Why:Por qué: Each interval covers 5 values (0,1,2,3,4 then 5,6,7,8,9 etc.), so the width is 5.Cada intervalo cubre 5 valores (0, 1, 2, 3, 4 y luego 5, 6, 7, 8, 9, etc.), así que el ancho es 5.
Say the question in your own words. Circle what you know and underline what you need to find.
Explica la pregunta con tus propias palabras. Encierra lo que sabes y subraya lo que debes hallar.
Careful: the highest scores (90–99) don't mean the most students. Find the largest of the five frequencies first, then read off its interval.
Cuidado: los puntajes más altos (90–99) no significan la mayor cantidad de estudiantes. Halla primero la mayor de las cinco frecuencias y luego lee su intervalo.
Start here: 'Most students' means the highest frequency — compare the counts 2, 5, 10, 8, 3, not the score ranges themselves.
Empieza aquí: 'La mayoría de los estudiantes' significa la frecuencia más alta — compara los conteos 2, 5, 10, 8, 3, no los rangos de puntajes.
A histogram of test scores shows: 50–59: 2, 60–69: 5, 70–79: 10, 80–89: 8, 90–99: 3. Which interval has the most students?Un histograma de calificaciones muestra: 50–59: 2, 60–69: 5, 70–79: 10, 80–89: 8, 90–99: 3. ¿Qué intervalo tiene la mayor cantidad de estudiantes?
Answer key for families — compare, then talk about why.Clave de respuestas para la familia — comparen y hablen del porqué.
Not tried yet? Close this and give it one try first. A wrong first try still helps.¿Todavía no lo intentaron? Ciérrenla y hagan un intento primero. Un primer intento equivocado también ayuda.
Why:Por qué: The 70–79 interval has the highest frequency of 10 students.El intervalo 70–79 tiene la frecuencia más alta, con 10 estudiantes.
Pick a game and play as a team. Nothing here is timed, and every game can be replayed as many times as you like. Escojan un juego y jueguen en equipo. Nada aquí tiene cronómetro, y pueden repetir cada juego cuantas veces quieran.
Try the recommended mission. Student: explain; partner: ask one question, then switch. Paper drawings work for every object. Prueba la misión recomendada. Estudiante: explica; acompañante: haz una pregunta, luego cambien. Puedes dibujar los objetos en papel.
One mission is enough. You can also work solo and explain in writing.Una misión es suficiente. También puedes trabajar a solas y explicar por escrito.
Collect six page counts from books, or use 8, 12, 12, 16, 20, 28. Apply tonight’s statistical question, display, or measure. Label what the numbers represent and explain one conclusion.
Recoge seis cantidades de páginas de libros, o usa 8, 12, 12, 16, 20, 28. Usa la pregunta, representación o medida estadística de hoy. Indica qué representan los números y explica una conclusión.
Show a labeled drawing, table, or equation. Your partner asks one question; working alone, write your explanation.
Muestra un dibujo con etiquetas, una tabla o una ecuación. Tu acompañante hace una pregunta; a solas, escribe tu explicación.
Choose ONE game. Quick Quiz practices this lesson; the other games review related skills. Play together or solo, without a timer. Elige UN juego. Reto rápido practica esta lección; los demás repasan temas relacionados. Juega acompañado o a solas, sin cronómetro.
Build a chain. The left side of each domino is the match for the problem on the end of the chain. Tap the domino that fits next. Armen una cadena. El lado izquierdo de cada ficha es la pareja del problema al final de la cadena. Toquen la ficha que encaja.
🎉 Chain complete! The last problem links back to the first domino: a perfect loop.¡Cadena completa! El último problema conecta con la primera ficha: un círculo perfecto.
Take turns — student answers one, then a family member answers the next. Watch for the trick statements! Por turnos: el estudiante responde una y luego un familiar responde la siguiente. ¡Cuidado con las trampas!
Tap a card, then tap the bin it belongs in. Talk it through before you tap! Toquen una tarjeta y luego el cesto al que pertenece. ¡Conversen antes de tocar!
Everyone votes and says WHY. Then tap to see what the math says — sometimes it is a tie! Todos votan y dicen POR QUÉ. Luego toquen para ver qué dicen las matemáticas: ¡a veces es empate!
🔎 What the math saysLo que dicen las matemáticas
Reinforce tonight's topic with a quick family game. You ask; your student decides! Refuercen el tema de hoy con un juego rápido en familia. ¡Ustedes preguntan; su estudiante decide!
🎮 Play together! Statistical questions expect many different answers from a group. 🎮 ¡Jueguen juntos! Las preguntas estadísticas esperan muchas respuestas diferentes de un grupo.
The bigger review game for tonight's lesson — sort, match and choose. A wrong answer gives a hint and lets your student try again. No timer. El juego de repaso más grande para la lección de hoy — clasificar, emparejar y elegir. Si se equivocan, reciben una pista y lo intentan otra vez. Sin cronómetro.
Explain one answer aloud or on paper: “I got ___ because ___. I checked by ___.” Include your strategy and units. Then you are done.Explica una respuesta en voz alta o en papel: “Obtuve ___ porque ___. Comprobé usando ___.” Incluye tu estrategia y las unidades. Después termina.
Name one strategy that helped, or one question to ask next time. You can stop here; no adult signature is needed.
Di una estrategia que te ayudó o una pregunta para la próxima vez. Puedes terminar aquí; no necesitas la firma de un adulto.
Answers save automatically on this device. Tap Check This Problem anytime. Las respuestas se guardan solas en este dispositivo. Toquen Revisar esta pregunta cuando quieran.
These extras are not required. Photos, recordings and reflections stay on this device. To send anything to Mr. Neft, use ClassDojo.Estos extras no son obligatorios. Las fotos, grabaciones y reflexiones quedan en este dispositivo. Para enviar algo al Sr. Neft, usa ClassDojo.
Saved on:Guardado el:
🔥 1-Night StreakRacha de 1 noche
Question draft (not sent):Borrador de pregunta (no enviado):
Family reflection:Reflexión familiar:
Student Work Photo:Foto del trabajo:
Student Voice Memo:Nota de voz del estudiante:
A personal record of practice for . Saved on this device; not submitted to the teacher.
Practice partner (optional)
Date
Use this as a photobooth for the work itself: point the camera at tonight's notebook page, the scratchpad or the whiteboard and take the picture — or pose holding it up. Choose a frame, add stickers, then download it, print it, or add it to your optional reflection. The photo is never uploaded; it stays on this device. Úsenla como cabina de fotos del trabajo: apunten la cámara a la página del cuaderno, al borrador o a la pizarra y tomen la foto, o posen sosteniéndola. Elijan un marco, agreguen calcomanías y luego descárguenla, imprímanla o agréguenla a la reflexión opcional. La foto nunca se sube a internet; se queda en este dispositivo.
Camera Ready!¡Cámara lista!
Tap “Start Camera” to photograph tonight’s work, or use “Upload Work” below. The photo stays on this device.Toca “Iniciar Cámara” para fotografiar el trabajo de hoy, o usa “Subir Foto”. La foto se queda en este dispositivo.
Holding your open notebook or paper up next to your smile makes the best shot! You can also snap a photo of just your written work. ¡Sostener el cuaderno abierto junto a su sonrisa crea la mejor foto! También pueden tomar la foto solo de su trabajo escrito.
Use equal-width, nonoverlapping intervals. Count every observation once.
Usa intervalos del mismo ancho que no se superpongan. Cuenta cada dato una vez.
Use these page counts: 1, 2, 2, 4, 5, 7. Draw intervals 0–2, 3–5, and 6–8.
Usa estas cantidades de páginas: 1, 2, 2, 4, 5, 7. Dibuja intervalos 0–2, 3–5 y 6–8.
Tally each count once. Draw touching bars with heights 3, 2, and 1.
Cuenta cada dato una vez. Dibuja barras juntas de alturas 3, 2 y 1.
Use a rule before checking what this question asks.
Usa una regla sin revisar qué pide esta pregunta.
These links go to specific videos and lessons about tonight's topic — not general math pages. Estos enlaces van a videos y lecciones específicas sobre el tema de hoy — no páginas generales.