Lesson 2-5: Describe Data by Range and Interquartile Range Reveal Math Grade 6

File
Edit
View
Format
Slide
Saved to Browser ✓
JN
Neft Teacher Unit 2
🏀

Describe Data by Range and Interquartile Range

6.DS.3 Lesson 2-5
My Math Notebook
I Can…

I can find the range and the interquartile range of a data set and use them to describe how spread out the data is.

Reveal Math Grade 6 How to Use 6.DS.3
🏀 SPORTS ANALYTICS

How to Use This Deck

Present

Click Present or press F11 for fullscreen. Use arrow keys to advance.

👩‍🏫Teacher cues

Blue boxes show exactly what to say, ask, and how long to spend.

👨‍🎓Student work

Text boxes, polls, and drag-sort save automatically in the browser.

📝Notes

Press N or click 📝 in the toolbar for pacing tips and answers.

🎮Activity link

Launch the full HTML activity for independent practice.

🖨️Print

File → Print or the print button for handout copies.

⏱️ Time: 30 sec — read aloud, then advance
Reveal Math Grade 6 · Unit 2 · 2-5
Reveal Math Grade 6 Learning Targets 6.DS.3

🎯 Content Objective / Objetivo de contenido

I can find the range and the interquartile range of a data set and use them to describe how spread out the data is.

Reveal Math Grade 6 · Unit 2 · 2-5
Reveal Math Grade 6 Agenda 6.DS.3
🏀 SPORTS ANALYTICS

Today's Flow

1 Warm-Up 5m
2 Vocabulary 8m
3 I Do 5m
4 We Do 5m
5 Explore 8m
6 Practice 10m
7 Connect 5m
8 Exit Ticket 5m

Total pacing: ~45 min · Progress bar at top tracks your place

Reveal Math Grade 6 · Unit 2 · 2-5
🏀
Lesson Phase

LAUNCH

⏱ ~10 min

Reveal Math Grade 6 Warm-Up Hook 6.DS.3

⏱️ 3 MIN · THINK-PAIR-SHARE

Two classes have the same median score, 81. Can you tell which class did better? What else would you need to know?

medianspread outrangeinterquartile rangevary
Reveal Math Grade 6 · Unit 2 · 2-5
Reveal Math Grade 6 CFU 1 6.DS.3
🏀 SPORTS ANALYTICS

Check for Understanding #1

✋ CFU · THUMBS
Ask: Can you restate the warm-up question in your own words?
⏱️ Time: 30 sec

Teacher: If >30% thumbs down, re-teach with a fresh example before moving on.

Reveal Math Grade 6 · Unit 2 · 2-5
Reveal Math Grade 6 Be Curious 6.DS.3
Visual Prompt

Spread Detective

The league analyst is comparing two sixth-grade classes that took the same math test. Both classes have the SAME median score, 81 — so the medians alone cannot tell them apart. Your job is to measure how spread out each class's scores are, using the range and the interquartile range, and decide which class did better overall.
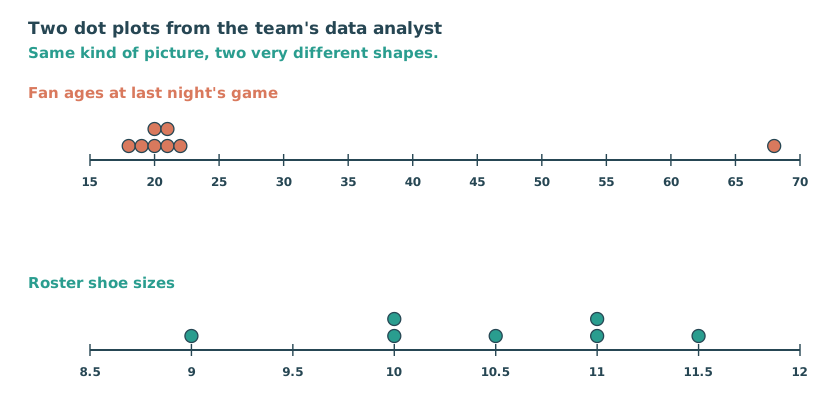
Two dot plots drawn to the same scale: fan ages at last night's game, and roster shoe sizes.
👁 I Notice...
🔹 I notice the lowest score in the data set is ___.
🔹 I notice the highest score in the data set is ___.
🔹 I notice the middle half of the scores runs from ___ to ___.
💭 I Wonder...
🔹 I wonder what one number could describe how spread out all the scores are ___.
🔹 I wonder why the middle half might describe the class better than ___.
Reveal Math Grade 6 · Unit 2 · 2-5
Reveal Math Grade 6 Concept Launch 6.DS.3
🎯 I can find the range and the interquartile range of a data set and use them to describe how spread out the data is.
🏀 SPORTS ANALYTICS

Concept Launch

💡 How spread out is the data?

👩‍🏫 Say: This is the big idea for today. Students should be able to repeat it by the end.

A measure of center like the median tells you where the data sits. It does not tell you how far apart the values are. Two classes can share the same median and still look nothing alike. Range and interquartile range are the two numbers that describe that spread.

Key Idea:

Measures of Variability: Range & IQR. Formula: Range = Maximum − Minimum | IQR = Q3 − Q1. 1. Range measures the total spread across the entire data set. 2. IQR (Interquartile Range) measures the spread of the middle 50% of data. 3. Both are non-negative distance measures of variability

Reveal Math Grade 6 · Unit 2 · 2-5
Reveal Math Grade 6 I Do — Watch Me 6.DS.3
Reveal Math Grade 6 · Unit 2 · 2-5
Reveal Math Grade 6 I Do — Key Step 6.DS.3
Reveal Math Grade 6 · Unit 2 · 2-5
Reveal Math Grade 6 We Do — Together 6.DS.3
Reveal Math Grade 6 · Unit 2 · 2-5
Reveal Math Grade 6 CFU 2 6.DS.3
🏀 SPORTS ANALYTICS

Check for Understanding #2

✋ CFU · THUMBS
Ask: Can you explain what we did in the We Do example?
⏱️ Time: 30 sec

Teacher: If >30% thumbs down, re-teach with a fresh example before moving on.

Reveal Math Grade 6 · Unit 2 · 2-5
Reveal Math Grade 6 You Do — Your Turn 6.DS.3
🎯 I can find the range and the interquartile range of a data set and use them to describe how spread out the data is.
🏀 SPORTS ANALYTICS

Your turn

👨‍🎓 Students: Work independently first, then check with a partner.
⏱️ Time: 5 min
1Class B's box plot reads: least 70, Q1 76, median 81, Q3 84, greatest 90.
2Find the range: greatest − least.
3Find the IQR: Q3 − Q1.
4Class A and Class B have the SAME median, 81. Which class's scores are less spread out — and how do your two numbers show it?
🎮

Open the interactive HTML activity for full practice.

Launch Activity ↗
Reveal Math Grade 6 · Unit 2 · 2-5
📚
Lesson Phase

VOCABULARY

⏱ ~8 min

Reveal Math Grade 6 Vocabulary 6.DS.3
Term / Término Meaning / Significado Example / Ejemplo Visual
Range and Interquartile Range
Rango y rango intercuartílico
Two numbers that describe spread: the range covers all the data, and the interquartile range covers only the middle half.
Dos números que describen la dispersión: el rango cubre todos los datos y el rango intercuartílico solo la mitad central.
Range 26 covers 68 to 94; IQR 12.5 covers only 75.5 to 88
Range
Rango
The distance from the least value to the greatest value, found by subtracting: greatest − least.
La distancia del valor menor al mayor, que se halla restando: mayor − menor.
94 − 68 = 26
Quartile
Cuartil
One of the three values that cut an ordered data set into four equal-sized groups.
Uno de los tres valores que dividen un conjunto ordenado de datos en cuatro grupos del mismo tamaño.
Q1 = 75.5, median = 83.5, Q3 = 88
Interquartile range
Rango intercuartílico
The distance across the middle half of the data, found by subtracting the first quartile from the third: Q3 − Q1.
La distancia a lo largo de la mitad central de los datos: se resta el primer cuartil del tercero: Q3 − Q1.
88 − 75.5 = 12.5 — the width of the box on a box plot
Variability
Variabilidad
How much the values in a data set differ from one another — whether they sit close together or far apart.
Cuánto se diferencian entre sí los valores de un conjunto de datos: si están juntos o muy separados.
Close together = low variability; spread apart = high variability
Measure of variation
Medida de variación
A single number that describes the spread of a whole data set. The range and the IQR are both measures of variation.
Un solo número que describe la dispersión de todo un conjunto de datos. El rango y el RIC son medidas de variación.
One number stands in for the spread of all 20 scores
Range and Interquartile Range: example vs. non-example
Range 26 with IQR 12.5The IQR is always the smaller of the two — it sits inside the range.
Range 12.5 with IQR 26The middle half cannot be wider than all of the data.
Reveal Math Grade 6 · Unit 2 · 2-5
Reveal Math Grade 6 Which Word? 6.DS.3
🎯 I can find the range and the interquartile range of a data set and use them to describe how spread out the data is.
🏀 SPORTS ANALYTICS

Which Word Fits?

❓ CLOZE POLL
Ask: Vote A B C D — then defend your choice.

The range uses the ___ values; the interquartile range uses the ___.

Use It In a Sentence

Reveal Math Grade 6 · Unit 2 · 2-5
Reveal Math Grade 6 CFU 3 6.DS.3
🏀 SPORTS ANALYTICS

Check for Understanding #3

✋ CFU · THUMBS
Ask: Use one vocabulary word in a sentence about today's topic.
⏱️ Time: 30 sec

Teacher: If >30% thumbs down, re-teach with a fresh example before moving on.

Reveal Math Grade 6 · Unit 2 · 2-5
Reveal Math Grade 6 Turn & Talk 6.DS.3
🎯 I can find the range and the interquartile range of a data set and use them to describe how spread out the data is.
🏀 SPORTS ANALYTICS

Turn & Talk — Launch

🗣️ TURN & TALK
👩‍🏫 Say: Partner A shares first for 45 seconds, then Partner B.
👨‍🎓 Students: Turn to your elbow partner. Use the sentence stems.
⏱️ Time: 90 sec

Two classes have the same median score, 81. Can you tell which class did better? What else would you need to know?

Sentence starters (tap to use):
✍️ The medians are the same, so I still need to know how ___ the scores are.Las medianas son iguales, así que todavía necesito saber qué tan ___ están los puntajes.
✍️ I would want to compare the ___ and the ___ of each class.Querría comparar el ___ y el ___ de cada clase.
Stretch further:
➕ They could still differ because the ___ describes the middle half.
WORD BANK:
medianspread outrangeinterquartile rangevary
90s

👂 Listen For

Students name a measure of spread rather than another measure of center.

Extend: Could two classes have the same median AND the same range and still look different?

Reveal Math Grade 6 · Unit 2 · 2-5
🔍
Lesson Phase

EXPLORE & PRACTICE

⏱ ~18 min

Reveal Math Grade 6 Visual Model 6.DS.3
🎯 I can find the range and the interquartile range of a data set and use them to describe how spread out the data is.
🏀 SPORTS ANALYTICS

Visual Modeling Workspace

Use the drawing tray below to annotate the visual model. Teacher: say "Click to reveal" on key steps.

History test scores — box plot65707580859095Min (68)Q1 (75.5)Med (83.5)Q3 (88)Max (94)Range = 94 − 68 = 26 (the whole span, whisker tip to whisker tip). IQR = 88 − 75.5 = 12.5 (just the width of the box — the middle half).
Reveal Math Grade 6 · Unit 2 · 2-5
Reveal Math Grade 6 Explore 6.DS.3
🏀 SPORTS ANALYTICS

Explore Activity

Each statement describes a spread. Sort it under the measure that produced it.

rangeinterquartile rangemiddle halfquartilespread outvary

✍️ Explore Discourse

Both numbers describe spread. Why might a coach trust the IQR more than the range when one player had a record-breaking night?

I would use the ___ because it only uses the ___, so one unusual value cannot ___.
Reveal Math Grade 6 · Unit 2 · 2-5
Reveal Math Grade 6 Whiteboard CFU 6.DS.3
🎯 I can find the range and the interquartile range of a data set and use them to describe how spread out the data is.
🏀 SPORTS ANALYTICS

Whiteboard Moment

🖊️ WHITEBOARD CFU
👨‍🎓 Students: On your whiteboard or paper, solve ONE quick problem using today's strategy. Hold it up when done.
⏱️ Time: 2 min

Show your work clearly. Be ready to explain your thinking to a partner.

Reveal Math Grade 6 · Unit 2 · 2-5
Reveal Math Grade 6 Discuss Explore 6.DS.3
🎯 I can find the range and the interquartile range of a data set and use them to describe how spread out the data is.
🏀 SPORTS ANALYTICS

Turn & Talk — Explore

🗣️ TURN & TALK
👩‍🏫 Say: Partner A shares first for 45 seconds, then Partner B.
👨‍🎓 Students: Turn to your elbow partner. Use the sentence stems.
⏱️ Time: 90 sec

Why does the range change a lot when one unusual value is added, but the IQR barely moves?

Sentence starters (tap to use):
✍️ The range uses the ___ and ___ values, so one unusual value ___ it.El rango usa los valores ___ y ___, así que un valor inusual lo ___.
✍️ The IQR only uses ___ and ___, which are inside the data.El RIC solo usa ___ y ___, que están dentro de los datos.
Stretch further:
➕ I would report the ___ because one game cannot ___ it.
WORD BANK:
leastgreatestQ1Q3stretchesmiddle half
90s

👂 Listen For

Students point at WHICH values each measure subtracts, not just at the results.

Extend: Which measure would you report to a coach after a record-breaking game, and why?

Reveal Math Grade 6 · Unit 2 · 2-5
Reveal Math Grade 6 Practice A 6.DS.3
🎯 I can find the range and the interquartile range of a data set and use them to describe how spread out the data is.
🏀 SPORTS ANALYTICS

Practice Check A

📝 QUICK CHECK
Ask: Give students 1 minute. Cold-call one student to defend their answer.
⏱️ Time: 2 min

A box plot shows: least 68, Q1 75.5, median 83.5, Q3 88, greatest 94. What are the range and the IQR?

✍️ Show Your Work

Explain why your answer is correct using today's vocabulary.

Teacher reveal: Range = 94 − 68 = 26. IQR = 88 − 75.5 = 12.5. The range covers the whole span; the IQR covers only the box.
Reveal Math Grade 6 · Unit 2 · 2-5
Reveal Math Grade 6 Practice B 6.DS.3
🎯 I can find the range and the interquartile range of a data set and use them to describe how spread out the data is.
🏀 SPORTS ANALYTICS

Practice Check B

📝 QUICK CHECK
Ask: Partner discussion first, then vote.
⏱️ Time: 2 min

Team A's salaries have a range of $14M and an IQR of $7M. Team B's have a range of $7M and an IQR of $2.5M. Both teams have the same median salary. What does this tell a player?

✍️ Show Your Work

Explain why your answer is correct using today's vocabulary.

Teacher reveal: Both measures of variation are smaller for Team B, so its salaries vary less: a typical player is more likely to earn close to the median. Team A spreads much wider in both directions.
Reveal Math Grade 6 · Unit 2 · 2-5
Reveal Math Grade 6 Statistical vs Not Sort 6.DS.3
🎯 I can find the range and the interquartile range of a data set and use them to describe how spread out the data is.
🏀 SPORTS ANALYTICS

Statistical vs Not Sort

📈 CARD SORT
👨‍🎓 Students: Work at your own pace. Check with a partner before we discuss.
⏱️ Time: 5 min

Drag each question into the correct column.

How many hours do students sleep?
What is the capital of France?
How tall are the plants in our class garden?
What color is your backpack?
How many pets do families in our school have?
Who invented the telephone?
📊 Statistical
📚 Not Statistical

✍️ Justify Your Thinking

Reveal Math Grade 6 · Unit 2 · 2-5
Reveal Math Grade 6 Sort It Out 6.DS.3

Sort each label into the correct box.

Card Bank — cut or drag these cards:
The range grows a lot
The IQR barely changes
Reveal Math Grade 6 · Unit 2 · 2-5
Reveal Math Grade 6 Error Analysis 6.DS.3
⚠ Find the error

A classmate turned in the work below. One step has a mistake. Read every step, find it, name it, and fix it.

Student's work — read every step:
1 Setup Class A: least 62, Q1 74, median 81, Q3 87, greatest 90.
2 Setup Class B: least 70, Q1 76, median 81, Q3 84, greatest 90.
3 Step 1 Both classes have a median of 81.
4 Step 2 Both classes reached the same greatest score, 90.
5 Step 3 So the two classes performed the same overall.
Which step has the error?
Reveal Math Grade 6 · Unit 2 · 2-5
Reveal Math Grade 6 Choice Board 6.DS.3

Choose ONE option to show what you know — then do it in the workspace below.

Reveal Math Grade 6 · Unit 2 · 2-5
Reveal Math Grade 6 Think Write 6.DS.3

Use evidence from today's lesson to complete each frame.

Frame 1 Explain the Rule

Today's key idea is: "Measures of Variability: Range & IQR. Formula: Range = Maximum − Minimum | IQR = Q3 − Q1. 1. Range measures the total spread across the entire data set. 2. IQR (Interquartile Range) measures the spread of the middle 50% of data. 3. Both are non-negative distance measures of variability" — and it works because ___.

Frame 2 Because / But / So

Because Range and Interquartile Range means ___, but a tricky part is ___, so I have to ___.

Frame 3 Catch the Mistake

A common mistake with Range and Interquartile Range is ___. It happens because ___, and the fix is ___.

Frame 4 Prove It

I can prove my answer is correct by ___, using Range to check my work.

Reveal Math Grade 6 · Unit 2 · 2-5
Reveal Math Grade 6 Because · But · So 6.DS.3

✍️ TWR · WRITE 3 SENTENCES · 7 MIN

Sentence kernelMeasures of Variability: Range & IQR. Formula: Range = Maximum − Minimum | IQR = Q3 − Q1. 1. Range measures the total spread across the entire data set. 2. IQR (Interquartile Range) measures the spread of the middle 50% of data. 3. Both are non-negative distance measures of variability
because
Give a reason

Measures of Variability: Range & IQR. Formula: Range = Maximum − Minimum | IQR = Q3 − Q1. 1. Range measures the total spread across the entire data set. 2. IQR (Interquartile Range) measures the spread of the middle 50% of data. 3. Both are non-negative distance measures of variability because ___

but
Name a tricky part

Measures of Variability: Range & IQR. Formula: Range = Maximum − Minimum | IQR = Q3 − Q1. 1. Range measures the total spread across the entire data set. 2. IQR (Interquartile Range) measures the spread of the middle 50% of data. 3. Both are non-negative distance measures of variability but ___

so
State what it means

Measures of Variability: Range & IQR. Formula: Range = Maximum − Minimum | IQR = Q3 − Q1. 1. Range measures the total spread across the entire data set. 2. IQR (Interquartile Range) measures the spread of the middle 50% of data. 3. Both are non-negative distance measures of variability so ___

Reveal Math Grade 6 · Unit 2 · 2-5
Reveal Math Grade 6 Sentence Expansion 6.DS.3

🌱 TWR · GROW THE KERNEL · 6 MIN

Sentence kernelToday we used Range and Interquartile Range.

Answer these to add detail

What exactly?When?Where in real life?Why does it work?How did we use it?

Sentence starters (tap to use)

First, …For example, …This means that …In other words, …As a result, …I know this because …
Reveal Math Grade 6 · Unit 2 · 2-5
Reveal Math Grade 6 Student Workspace 6.DS.3
🎯 I can find the range and the interquartile range of a data set and use them to describe how spread out the data is.
🏀 SPORTS ANALYTICS

Student Workspace

📊 FILL THE TABLE
👨‍🎓 Students: Complete the missing cells. Check with a partner before we discuss.
⏱️ Time: 5 min

Fill in the table using today's strategy.

Column AColumn B

✏️ Sketch Your Strategy

Reveal Math Grade 6 · Unit 2 · 2-5
Reveal Math Grade 6 Differentiation 6.DS.3
🏀 SPORTS ANALYTICS

Differentiation Paths

🎯 CHOOSE YOUR LEVEL
👩‍🏫 Say: Everyone works on the same math goal — pick the level of support that fits today.
⏱️ Time: 8–10 min independent or partner
🧩 Level 0 · Most support

Step-by-step with a worked model and sentence frames.

🌱 Level 1 · Support

A data set runs from a least value of 12 to a greatest value of 30. What is the range?

🎯 Level 2 · Core

A box plot shows: least 68, Q1 75.5, median 83.5, Q3 88, greatest 94. What are the range and the IQR?

🚀 Level 2+ · Enrichment

Extension with error analysis or multi-step reasoning.

Reveal Math Grade 6 · Unit 2 · 2-5
Reveal Math Grade 6 Partner Activity 6.DS.3
🎯 I can find the range and the interquartile range of a data set and use them to describe how spread out the data is.
🏀 SPORTS ANALYTICS

Partner Activity

🤝 PARTNER WORK
📦 Materials: Whiteboards or paper, pencils, vocabulary reference cards
👨‍🎓 Students: Partner A solves, Partner B coaches. Switch roles on the next problem.
⏱️ Time: 6 min

Work with your partner on the practice problems at your differentiation path level. Explain each step using math vocabulary.

Reveal Math Grade 6 · Unit 2 · 2-5
Reveal Math Grade 6 CFU 4 6.DS.3
🏀 SPORTS ANALYTICS

Check for Understanding #4

✋ CFU · THUMBS
Ask: Thumbs up if you and your partner agree on your answer.
⏱️ Time: 30 sec

Teacher: If >30% thumbs down, re-teach with a fresh example before moving on.

Reveal Math Grade 6 · Unit 2 · 2-5
Reveal Math Grade 6 Math in the Wild 6.DS.3
🎯 I can find the range and the interquartile range of a data set and use them to describe how spread out the data is.
🏀 SPORTS ANALYTICS

Real-World Connection

🌍 Math in the Wild

👩‍🏫 Say: Read the scenario. Ask: where else have you seen this kind of math?

Two sixth-grade classes took the same math test. Class A's box plot reads least 62, Q1 74, median 81, Q3 87, greatest 90. Class B's reads least 70, Q1 76, median 81, Q3 84, greatest 90. Both classes have a median of 81, so the median alone cannot tell you which class did better overall.

2820spread out138smaller76overall

✍️ Connection Reasoning

Which class scored better overall, and how do the range and the IQR show it?

Class A's range is ___ and Class B's range is ___, so Class A's scores are more ___. Class A's IQR is ___ and Class B's IQR is ___, so the middle half of Class B is packed into a ___ stretch of points. Because 75% of Class B scored ___ or more, Class B did better ___.

Reveal Math Grade 6 · Unit 2 · 2-5
Reveal Math Grade 6 Discuss Connect 6.DS.3
🎯 I can find the range and the interquartile range of a data set and use them to describe how spread out the data is.
🏀 SPORTS ANALYTICS

Turn & Talk — Connect

🗣️ TURN & TALK
👩‍🏫 Say: Partner A shares first for 45 seconds, then Partner B.
👨‍🎓 Students: Turn to your elbow partner. Use the sentence stems.
⏱️ Time: 90 sec

Class A's IQR is 13 and Class B's is 8. Say what that means in the context of the test, not just in numbers.

Sentence starters (tap to use):
✍️ An IQR of ___ means the middle half of that class differed by only ___ points.Un RIC de ___ significa que la mitad central de esa clase se diferenció por solo ___ puntos.
✍️ Class ___ is more consistent because its box is ___.La clase ___ es más consistente porque su caja es más ___.
Stretch further:
➕ Not always, because a class could be consistently ___.
WORD BANK:
interquartile rangemiddle halfpointsconsistentnarrower
90s

👂 Listen For

Students translate the number into students and points, not just 'smaller'.

Extend: Does a smaller IQR always mean a class did better?

Reveal Math Grade 6 · Unit 2 · 2-5
Reveal Math Grade 6 Summarize 6.DS.3
🎯 I can find the range and the interquartile range of a data set and use them to describe how spread out the data is.
Key Concept

Summarize: Describe Data by Range and Interquartile Range

Measures of Variability: Range & IQR. Formula: Range = Maximum − Minimum | IQR = Q3 − Q1. 1. Range measures the total spread across the entire data set. 2. IQR (Interquartile Range) measures the spread of the middle 50% of data. 3. Both are non-negative distance measures of variability

In your own words:

Reveal Math Grade 6 · Unit 2 · 2-5
Lesson Phase

CLOSURE & REFLECT

⏱ ~8 min

Reveal Math Grade 6 Exit Ticket 6.DS.3
Reflection

Today I learned that ___ because ___.

One thing I am still not sure about is ___.

Quick Exit Ticket

A box plot has Q1 = 20 and Q3 = 36, with a least value of 10 and a greatest value of 50. What is the IQR, and what does it tell you?

Reveal Math Grade 6 · Unit 2 · 2-5
Reveal Math Grade 6 Goal Tracker 6.DS.3
My Goal: I can find the range and the interquartile range of a data set and use them to describe how spread out the data is.
Reveal Math Grade 6 · Unit 2 · 2-5
Reveal Math Grade 6 Bonus Check 6.DS.3
🎯 I can find the range and the interquartile range of a data set and use them to describe how spread out the data is.
🏀 SPORTS ANALYTICS

Bonus Exit Check

📝 QUICK CHECK
Ask: Optional for early finishers.
⏱️ Time: 2 min

A data set runs from a least value of 12 to a greatest value of 30. What is the range?

✍️ Show Your Work

Explain why your answer is correct using today's vocabulary.

Teacher reveal: Range = greatest − least = 30 − 12 = 18.
Reveal Math Grade 6 · Unit 2 · 2-5
Reveal Math Grade 6 Reflection 6.DS.3
🏀 SPORTS ANALYTICS

Reflection & Self-Assessment

3 Things I learned:
2 Connections:
1 Question:
Self-Assessment:
Reveal Math Grade 6 · Unit 2 · 2-5
Reveal Math Grade 6 Digital Activity 6.DS.3
🏀 SPORTS ANALYTICS

Continue Learning

🎮

Launch the Full Interactive Activity

Students continue practice in the HTML lesson engine with auto-check, hints, and differentiation.

👩‍🏫 Say: Early finishers: open the activity. Everyone else: start homework tonight.
Reveal Math Grade 6 · Unit 2 · 2-5
Reveal Math Grade 6 Family Connection 6.DS.3
🏀 SPORTS ANALYTICS

Family Connection

Share tonight's family homework and discuss one vocabulary word at home.

Open Family Homework ↗
👩‍🏫 Say: Tell families: "Ask your student to teach you one thing from today's lesson."
Reveal Math Grade 6 · Unit 2 · 2-5
Reveal Math Grade 6 Teacher Notes 6.DS.3
🏀 SPORTS ANALYTICS

Teacher Notes

⏱️ Pacing Guide

  • Launch & vocab: 12 min
  • I Do / We Do / You Do: 15 min
  • Explore & practice: 15 min
  • Connect & closure: 8 min

Total: ~45 min

🎯 Listen For · Common Errors

• Students name a measure of spread rather than another measure of center.

• Students point at WHICH values each measure subtracts, not just at the results.

• Students translate the number into students and points, not just 'smaller'.

• Both definitions are stated as subtractions, with the correct values named.

Common mistake: A common mistake with Range and Interquartile Range is adding the two quartiles instead of subtracting them — writing IQR = Q3 + Q1. With Q1 = 42 and Q3 = 58 that gives 100, which is larger than the data set's entire range of 20. Every measure of variation is a DIFFERENCE, and the IQR can never exceed the range, because the middle half is part of the whole span. If your IQR comes out bigger than your range, you added when you should have subtracted.

Reveal Math Grade 6 · Unit 2 · 2-5
Reveal Math Grade 6 Answer Key 6.DS.3
🏀 SPORTS ANALYTICS

Answer Key (Teacher Appendix)

Hide this slide during presentation or move to the end of your copy.

✓ Practice 1: Range 26, IQR 12.5 — Range = 94 − 68 = 26. IQR = 88 − 75.5 = 12.5. The range covers the whole span; the IQR covers only the box.

✓ Practice 2: Team B's salaries cluster much more tightly around the median — Both measures of variation are smaller for Team B, so its salaries vary less: a typical player is more likely to earn close to the median. Team A spreads much wider in both directions.

✓ Practice 3: 18 — Range = greatest − least = 30 − 12 = 18.

✓ Practice 4: 16 — IQR = Q3 − Q1 = 36 − 20 = 16.

✓ Exit ticket: IQR = 16; the middle half of the data spans 16 units — IQR = Q3 − Q1 = 36 − 20 = 16. Because it runs from Q1 to Q3, it describes only the middle half of the values — the width of the box.

Reveal Math Grade 6 · Unit 2 · 2-5
Reveal Math · Unit 2 · Lesson 2-5 STANDARD: 6.DS.3
1 / 49
00:00