Touch and changeToca y cambia
Move, type, tap, or drag in the model. Watch what changes.Mueve, escribe, toca o arrastra en el modelo. Observa qué cambia.
Unit 8 · Equations and Inequalities Unidad 8 · Ecuaciones y desigualdades
Understand Inequalities and Their SolutionsComprender las desigualdades y sus soluciones
6.AT.9 ▾This lesson builds proficiency in Grade 6 mathematical standard 6.AT.9.Esta lección desarrolla destrezas en el estándar matemático de 6.º grado 6.AT.9.
Optional, ungraded practice. Work with someone or on your own; no adult signature is needed. Práctica opcional, sin calificación. Trabaja con alguien o a solas; no necesitas la firma de un adulto.
All practice is optional and ungraded. Choose the time that works for your family; your route choice is saved on this device.Toda la práctica es opcional y no lleva calificación. Elijan el tiempo que les funcione; la ruta queda guardada en este dispositivo.
Family Math Studio selected: 6 problems, key words, one home mission, and one math game. Go at your own pace. Estudio familiar seleccionado: 6 problemas, palabras clave, una misión en casa y un juego de matemáticas. Avancen a su ritmo.
💡 Draw fraction bars, tape diagrams, equations, or line up decimals together!💡 ¡Dibujen barras de fracciones, modelos o alineen decimales juntos!
Tonight we graph an inequality on a number line. We draw a circle at the boundary number and shade the side that works.
Esta noche graficamos una desigualdad en una recta numérica. Dibujamos un círculo en el número límite y sombreamos el lado que cumple.
For the grown-up helping tonightPara el adulto que ayuda hoy
Real example: graph t ≥ 2 (the suspect arrived no earlier than 2:00).
Ejemplo real: grafica t ≥ 2 (el sospechoso llegó no antes de las 2:00).
The boundary number is 2.
El número límite es 2.
Decide the circle.
Decide el círculo.
The symbol ≥ includes 2, so we draw a closed (filled) circle at 2.
El símbolo ≥ incluye el 2, así que dibujamos un círculo cerrado (relleno) en el 2.
Decide the direction.
Decide la dirección.
'Greater than or equal to' means larger numbers work, so we shade to the right.
'Mayor o igual que' significa que los números mayores cumplen, así que sombreamos a la derecha.
Now the graph shows 2, 3, 4, and every value above 2 — all the answers at one glance.
Ahora la gráfica muestra 2, 3, 4 y todos los valores por encima del 2 — todas las respuestas de un vistazo.
Listen for "open circle / closed circle" (círculo abierto / círculo cerrado) — open leaves the number out, closed includes it.
Escucha "círculo abierto / círculo cerrado" — abierto deja el número fuera, cerrado lo incluye.
Listen for "solution set" (conjunto solución) — all the numbers the shading covers.
Escucha "conjunto solución" — todos los números que cubre el sombreado.
Ask two questions: "Open or closed circle?" and "Shade left or right?" before drawing.
Pregunta dos cosas: "¿Círculo abierto o cerrado?" y "¿Sombreo a la izquierda o a la derecha?" antes de dibujar.
Move the point. Use its position to describe or compare the numbers.Mueve el punto. Usa su posición para describir o comparar los números.
🌐 Esta herramienta interactiva por ahora solo está en inglés. Para qué sirve: Lee una desigualdad graficada —círculo abierto o cerrado, sombreado a la izquierda o a la derecha— y escribe la desigualdad que muestra. Usen los pasos en español de esta tarjeta para guiarse.
Move, type, tap, or drag in the model. Watch what changes.Mueve, escribe, toca o arrastra en el modelo. Observa qué cambia.
Record one equation, value, or relationship you can see.Escribe una ecuación, un valor o una relación que puedas ver.
I notice ___ changes when ___ changes. This shows ___.Noto que ___ cambia cuando ___ cambia. Esto muestra ___.
Ask: "Where do you see the numbers from tonight's math in this model?"Pregunta: "¿Dónde ves los números de la tarea de hoy en este modelo?"
Engineers design theme park rides with inequalities! 'Height h ≥ 48 inches' means exactly 48 inches or taller can ride. Speed governors use 'speed s ≤ 65 mph' to keep every turn thrilling yet safe. ¡Los ingenieros diseñan las atracciones con desigualdades! 'Estatura h ≥ 48 pulgadas' significa 48 pulgadas o más. Los reguladores usan 'velocidad s ≤ 65 mph' para que cada curva sea emocionante y segura.
Forgetting whether the boundary number itself is included (> vs ≥). Olvidar si el número límite está incluido o no (> frente a ≥).
1. Tap a card to flip it. 2. Play the quiz. 3. Match the words. 1. Toca una tarjeta para voltearla. 2. Juega el quiz. 3. Empareja las palabras.
Representar desigualdades en una recta numérica
Representar desigualdades en una recta numérica
Show every solution to an inequality on a number line with a boundary point and an arrow.
ES Mostrar cada solución de una desigualdad en una recta numérica con un punto límite y una flecha.
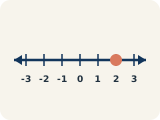
Recta numérica
Recta numérica
A straight line where numbers are placed in order; numbers get smaller to the left and larger to the right.
ES Una recta donde los números se colocan en orden; los números son menores a la izquierda y mayores a la derecha.
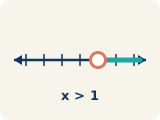
Círculo abierto
Círculo abierto
An empty circle showing a number is NOT included.
ES Un círculo vacío que muestra que un número NO está incluido.
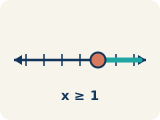
Círculo cerrado
Círculo cerrado
A filled-in circle showing a number IS included.
ES Un círculo relleno que muestra que un número SÍ está incluido.
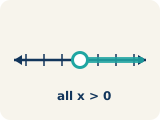
Conjunto solución
Conjunto solución
All the numbers that make the inequality true.
ES Todos los números que hacen verdadera la desigualdad.

Desigualdad
Desigualdad
A math sentence that compares two sides with <, >, ≤, or ≥.
ES Una oración matemática que compara dos lados con <, >, ≤ o ≥.
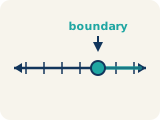
Punto límite
Punto límite
The number on the number line where the solution set starts.
ES El número en la recta numérica donde comienza el conjunto solución.
Enunciado verdadero
Enunciado verdadero
A sentence that the numbers make correct.
ES Un enunciado que los números hacen correcto.
Which word fits?¿Qué palabra encaja?
🎉 Quiz done!¡Quiz terminado!
First-try stars:Estrellas al primer intento:
Tap a word on the left, then tap its matching definition on the right! ¡Toca una palabra a la izquierda y su significado a la derecha!
Complete the 6 problems below. The extra practice at the bottom is optional. Completa los 6 problemas de abajo. La práctica extra al final es opcional.
A few problems to practice together. Each one has a step-by-step guide, a picture to draw on, and a space to show your work. Use Check This Problem for instant feedback — no need to finish everything at once. Unos problemas para practicar juntos. Cada uno tiene una guía paso a paso, un dibujo para trabajar y un espacio para mostrar el trabajo. Usen Revisar esta pregunta para retroalimentación al instante — no tienen que terminar todo de una vez.
Easier problems to practice the idea. Do these first together. Problemas más fáciles para practicar la idea. Hagan estos primero juntos.
Say the question in your own words. Circle what you know and underline what you need to find.
Explica la pregunta con tus propias palabras. Encierra lo que sabes y subraya lo que debes hallar.
≤ and ≥ use CLOSED circles because the boundary IS included.
≤ y ≥ usan círculos CERRADOS porque el límite SÍ se incluye.
Start here: < and > use OPEN circles because the boundary is not included.
Empieza aquí: < y > usan círculos ABIERTOS porque el límite no se incluye.
Sort by circle type: open or closed.Clasifica según el tipo de círculo: abierto o cerrado.
👪 On a phone, use Move to. On a computer, drag cards or tap a card then tap a column.👪 En el teléfono usen Mover a. En la computadora arrastren o toquen tarjeta y columna.
💡 < and > use OPEN circles because the boundary is not included.< y > usan círculos ABIERTOS porque el límite no se incluye.
💡 ≤ and ≥ use CLOSED circles because the boundary IS included.≤ y ≥ usan círculos CERRADOS porque el límite SÍ se incluye.
Answer key for families — compare, then talk about why.Clave de respuestas para la familia — comparen y hablen del porqué.
Not tried yet? Close this and give it one try first. A wrong first try still helps.¿Todavía no lo intentaron? Ciérrenla y hagan un intento primero. Un primer intento equivocado también ayuda.
Why:Por qué: The symbol alone decides the circle. x > 4, x < 12, and n > 0 use strict symbols, so the boundary number is not a solution and the circle stays open. x ≥ 7, x ≤ 3, and n ≥ 15 include the words 'or equal to' — that little bar under the symbol — so the boundary counts and the circle is filled in.El símbolo por sí solo decide el círculo. x > 4, x < 12 y n > 0 usan símbolos estrictos, así que el número frontera no es solución y el círculo queda abierto. x ≥ 7, x ≤ 3 y n ≥ 15 incluyen «o igual a» —esa rayita debajo del símbolo—, así que la frontera cuenta y el círculo se rellena.
Say the question in your own words. Circle what you know and underline what you need to find.
Explica la pregunta con tus propias palabras. Encierra lo que sabes y subraya lo que debes hallar.
Decide first whether running exactly 15 feet fits the phrase "more than 15 feet."
Primero decide si correr exactamente 15 pies cumple con la frase "más de 15 pies".
Start here: The circle shows whether the boundary number itself counts as a solution, and the shading shows every other number that works.
Empieza aquí: El círculo muestra si el número límite cuenta como solución, y el sombreado muestra todos los demás números que funcionan.
Clue: the witness ran more than 15 feet, so d > 15. On the number line, what do you draw?Pista: el testigo corrió más de 15 pies, así que d > 15. En la recta numérica, ¿qué dibujas?
👪 Read the question together, then let your student pick an answer before you discuss why.👪 Lean la pregunta juntos; dejen que su estudiante elija antes de hablar del porqué.
Answer key for families — compare, then talk about why.Clave de respuestas para la familia — comparen y hablen del porqué.
Not tried yet? Close this and give it one try first. A wrong first try still helps.¿Todavía no lo intentaron? Ciérrenla y hagan un intento primero. Un primer intento equivocado también ayuda.
Why:Por qué: 'Greater than' (>) is a strict symbol, so 15 is NOT included — open circle. Larger values work, so shade right."Mayor que" (>) es un símbolo estricto, así que 15 NO está incluido: círculo abierto. Los valores mayores sí funcionan, así que se sombrea hacia la derecha.
Say the question in your own words. Circle what you know and underline what you need to find.
Explica la pregunta con tus propias palabras. Encierra lo que sabes y subraya lo que debes hallar.
What makes your answer reasonable? Use the question to check it.
¿Por qué es razonable tu respuesta? Usa la pregunta para comprobarla.
Start here: Read each item carefully, then match based on what the problem is asking.
Empieza aquí: Marca el límite. Prueba ese valor y uno a cada lado; decide si incluyes el extremo.
Match each clue inequality to the correct graph in the case file.Une cada desigualdad de las pistas con la gráfica correcta del expediente.
👪 Say each term out loud, then talk through which match makes sense before choosing.👪 Digan cada término en voz alta y hablen de cuál pareja tiene sentido antes de elegir.
Answer key for families — compare, then talk about why.Clave de respuestas para la familia — comparen y hablen del porqué.
Not tried yet? Close this and give it one try first. A wrong first try still helps.¿Todavía no lo intentaron? Ciérrenla y hagan un intento primero. Un primer intento equivocado también ayuda.
Why:Por qué: Read the circle from the symbol and the shading from the direction it points: n > 13 → open circle at 13, shaded right; n ≤ 16 → closed circle at 16, shaded left; n ≥ 20 → closed circle at 20, shaded right; n < 17 → open circle at 17, shaded left. Checking the boundary number first eliminates half the cards fast.Saca el círculo del símbolo y el sombreado de hacia dónde apunta: n > 13 → círculo abierto en 13, sombreado a la derecha; n ≤ 16 → círculo cerrado en 16, sombreado a la izquierda; n ≥ 20 → círculo cerrado en 20, sombreado a la derecha; n < 17 → círculo abierto en 17, sombreado a la izquierda. Revisar primero el número frontera descarta rápido la mitad de las tarjetas.
Try these once the warm-up feels easy. It's okay to use the steps and pictures. Intenten estos cuando el calentamiento sea fácil. Está bien usar los pasos y los dibujos.
Say the question in your own words. Circle what you know and underline what you need to find.
Explica la pregunta con tus propias palabras. Encierra lo que sabes y subraya lo que debes hallar.
A closed circle means 8 itself is a solution, so the symbol needs the 'or equal' bar. Shading left means solutions are 8 or smaller.
Un círculo cerrado significa que el 8 sí es solución, así que el símbolo necesita la barra de 'o igual'. Sombrear a la izquierda significa que las soluciones son 8 o menos.
Start here: Read the graph's two clues: the circle at 8 is CLOSED, and the shading runs LEFT toward smaller numbers.
Empieza aquí: Lee las dos pistas de la gráfica: el círculo en el 8 está CERRADO y el sombreado va a la IZQUIERDA, hacia los números menores.
A number line shows a closed circle at 8 and is shaded to the left. Which inequality does this represent?Una recta numérica muestra un círculo cerrado en 8 y está sombreada hacia la izquierda. ¿Qué desigualdad representa esto?
Answer key for families — compare, then talk about why.Clave de respuestas para la familia — comparen y hablen del porqué.
Not tried yet? Close this and give it one try first. A wrong first try still helps.¿Todavía no lo intentaron? Ciérrenla y hagan un intento primero. Un primer intento equivocado también ayuda.
Why:Por qué: Closed circle means the value is included (≤ or ≥). Shaded left means less than or equal to: x ≤ 8.El círculo cerrado significa que el valor está incluido (≤ o ≥). El sombreado hacia la izquierda significa menor o igual que: x ≤ 8.
Say the question in your own words. Circle what you know and underline what you need to find.
Explica la pregunta con tus propias palabras. Encierra lo que sabes y subraya lo que debes hallar.
What makes your answer reasonable? Use the question to check it.
¿Por qué es razonable tu respuesta? Usa la pregunta para comprobarla.
Start here: Sort by the key operation or concept each item shows.
Empieza aquí: Marca el límite. Prueba ese valor y uno a cada lado; decide si incluyes el extremo.
Detective Okafor is filing clues. Sort each inequality by the circle its graph uses.La detective Okafor está archivando pistas. Clasifica cada desigualdad según el círculo que usa su gráfica.
Answer key for families — compare, then talk about why.Clave de respuestas para la familia — comparen y hablen del porqué.
Not tried yet? Close this and give it one try first. A wrong first try still helps.¿Todavía no lo intentaron? Ciérrenla y hagan un intento primero. Un primer intento equivocado también ayuda.
Why:Por qué: c > 20 and t < 11 use strict symbols, so 20 and 11 are not solutions and both get open circles. w ≥ 14 and m ≤ 2 include their boundaries — 14 ≥ 14 and 2 ≤ 2 are both true — so both get closed circles. The direction of the shading does not affect this sort at all.c > 20 y t < 11 usan símbolos estrictos, así que 20 y 11 no son soluciones y ambos llevan círculos abiertos. w ≥ 14 y m ≤ 2 incluyen sus fronteras —14 ≥ 14 y 2 ≤ 2 son verdaderos—, así que ambos llevan círculos cerrados. La dirección del sombreado no afecta para nada esta clasificación.
Say the question in your own words. Circle what you know and underline what you need to find.
Explica la pregunta con tus propias palabras. Encierra lo que sabes y subraya lo que debes hallar.
Test h = 48 in each rule: is 48 > 48 true or false? Is 48 ≥ 48 true or false? Each graph's circle type shows the same story.
Prueba h = 48 en cada regla: ¿es 48 > 48 verdadero o falso? ¿Es 48 ≥ 48 verdadero o falso? El tipo de círculo de cada gráfica cuenta la misma historia.
Start here: The child is EXACTLY 48 inches — right on the boundary. The two rides treat that boundary number differently.
Empieza aquí: El niño mide EXACTAMENTE 48 pulgadas, justo en el límite. Los dos juegos tratan ese número límite de manera distinta.
A theme park has two rides. Ride A requires height h > 48 inches. Ride B requires height h ≥ 48 inches. A child is exactly 48 inches tall. Which ride can they go on? Explain using number line graphs for both inequalities.Un parque de diversiones tiene dos juegos. El juego A requiere una estatura h > 48 pulgadas. El juego B requiere una estatura h ≥ 48 pulgadas. Un niño mide exactamente 48 pulgadas. ¿A cuál juego puede subirse? Explica usando gráficas en la recta numérica para las dos desigualdades.
👪 A complete sentence with math vocabulary is the goal — not a perfect paragraph.👪 Una oración completa con vocabulario matemático es la meta — no un párrafo perfecto.
Answer key for families — compare, then talk about why.Clave de respuestas para la familia — comparen y hablen del porqué.
Not tried yet? Close this and give it one try first. A wrong first try still helps.¿Todavía no lo intentaron? Ciérrenla y hagan un intento primero. Un primer intento equivocado también ayuda.
Why:Por qué: The child is exactly on the boundary, so test 48 in each rule. For Ride A, 48 > 48 is false, so the graph has an open circle at 48 and the child cannot ride. For Ride B, 48 ≥ 48 is true, so the graph has a closed circle at 48 and the child can ride B.El niño está exactamente en la frontera, así que prueba 48 en cada regla. En el Juego A, 48 > 48 es falso, así que la gráfica tiene un círculo abierto en 48 y el niño no puede subir. En el Juego B, 48 ≥ 48 es verdadero, así que la gráfica tiene un círculo cerrado en 48 y el niño sí puede subir al B.
Optional. Only if your student wants more — these are bonus problems. Opcional. Solo si tu estudiante quiere más — son problemas adicionales.
Say the question in your own words. Circle what you know and underline what you need to find.
Explica la pregunta con tus propias palabras. Encierra lo que sabes y subraya lo que debes hallar.
Decide whether exactly 4 suspects is permitted, since that choice sets the circle type.
Decide si se permiten exactamente 4 sospechosos, porque esa decisión define el tipo de círculo.
Start here: "At most" sets a ceiling — it names the largest value that is still allowed.
Empieza aquí: "Como máximo" pone un tope: nombra el valor más grande que todavía se permite.
Clue: the getaway car held at most 4 suspects, so s ≤ 4. How is this graphed?Pista: el carro de escape llevaba como máximo 4 sospechosos, así que s ≤ 4. ¿Cómo se grafica esto?
Answer key for families — compare, then talk about why.Clave de respuestas para la familia — comparen y hablen del porqué.
Not tried yet? Close this and give it one try first. A wrong first try still helps.¿Todavía no lo intentaron? Ciérrenla y hagan un intento primero. Un primer intento equivocado también ayuda.
Why:Por qué: 'Less than or equal to' (≤) includes 4 — closed circle. Smaller values work, so shade left."Menor o igual que" (≤) incluye el 4: círculo cerrado. Los valores menores también funcionan, así que se sombrea hacia la izquierda.
Say the question in your own words. Circle what you know and underline what you need to find.
Explica la pregunta con tus propias palabras. Encierra lo que sabes y subraya lo que debes hallar.
Strict symbols like < exclude the boundary, so check whether 5 makes x < 5 true. Then shade toward test values that work.
Los símbolos estrictos como < excluyen el límite, así que revisa si 5 hace verdadera x < 5. Luego sombrea hacia los valores de prueba que sí funcionan.
Start here: Every inequality graph asks two questions: is 5 itself a solution (circle type), and which side holds the solutions (shading)?
Empieza aquí: Toda gráfica de desigualdad hace dos preguntas: ¿es 5 mismo una solución (tipo de círculo) y de qué lado están las soluciones (sombreado)?
Which graph represents x < 5?¿Qué gráfica representa x < 5?
Answer key for families — compare, then talk about why.Clave de respuestas para la familia — comparen y hablen del porqué.
Not tried yet? Close this and give it one try first. A wrong first try still helps.¿Todavía no lo intentaron? Ciérrenla y hagan un intento primero. Un primer intento equivocado también ayuda.
Why:Por qué: x < 5 means 5 is NOT included (open circle) and values less than 5 are shaded (left).x < 5 significa que 5 NO está incluido (círculo abierto) y se sombrean los valores menores que 5 (hacia la izquierda).
Say the question in your own words. Circle what you know and underline what you need to find.
Explica la pregunta con tus propias palabras. Encierra lo que sabes y subraya lo que debes hallar.
The bar means 3 IS a solution, so the circle gets filled in. Then a quick test value tells you the shading side.
La barra significa que 3 SÍ es solución, así que el círculo se rellena. Luego un valor de prueba te dice el lado del sombreado.
Start here: Check the symbol: ≥ has the 'or equal' bar. What does that bar mean for the circle at 3?
Empieza aquí: Revisa el símbolo: ≥ tiene la barra de 'o igual'. ¿Qué significa esa barra para el círculo en el 3?
Which graph represents x ≥ 3?¿Qué gráfica representa x ≥ 3?
Answer key for families — compare, then talk about why.Clave de respuestas para la familia — comparen y hablen del porqué.
Not tried yet? Close this and give it one try first. A wrong first try still helps.¿Todavía no lo intentaron? Ciérrenla y hagan un intento primero. Un primer intento equivocado también ayuda.
Why:Por qué: x ≥ 3 means 3 IS included (closed circle) and values greater than or equal to 3 are shaded (right).x ≥ 3 significa que 3 SÍ está incluido (círculo cerrado) y se sombrean los valores mayores o iguales que 3 (hacia la derecha).
Say the question in your own words. Circle what you know and underline what you need to find.
Explica la pregunta con tus propias palabras. Encierra lo que sabes y subraya lo que debes hallar.
Symbols without the 'or equal' bar exclude the boundary. Then shade only the side where test numbers make the statement true.
Los símbolos sin la barra de 'o igual' excluyen el límite. Luego sombrea solo el lado donde los números de prueba hacen verdadero el enunciado.
Start here: Two decisions: does x = 8 make x > 8 true, and are the solutions bigger or smaller than 8?
Empieza aquí: Dos decisiones: ¿hace x = 8 verdadera x > 8, y las soluciones son mayores o menores que 8?
Which graph represents x > 8?¿Qué gráfica representa x > 8?
Answer key for families — compare, then talk about why.Clave de respuestas para la familia — comparen y hablen del porqué.
Not tried yet? Close this and give it one try first. A wrong first try still helps.¿Todavía no lo intentaron? Ciérrenla y hagan un intento primero. Un primer intento equivocado también ayuda.
Why:Por qué: x > 8 means 8 is NOT included (open circle) and values greater than 8 are shaded to the right.x > 8 significa que 8 NO está incluido (círculo abierto) y se sombrean los valores mayores que 8 (hacia la derecha).
Say the question in your own words. Circle what you know and underline what you need to find.
Explica la pregunta con tus propias palabras. Encierra lo que sabes y subraya lo que debes hallar.
The 'or equal' bar means the boundary is a solution — that decides the circle. A test value decides the shading.
La barra de 'o igual' significa que el límite es solución: eso decide el círculo. Un valor de prueba decide el sombreado.
Start here: Ask two things: does 10 itself satisfy x ≤ 10, and do solutions live above or below 10?
Empieza aquí: Pregunta dos cosas: ¿el 10 mismo cumple x ≤ 10, y las soluciones viven arriba o abajo de 10?
Which graph represents x ≤ 10?¿Qué gráfica representa x ≤ 10?
Answer key for families — compare, then talk about why.Clave de respuestas para la familia — comparen y hablen del porqué.
Not tried yet? Close this and give it one try first. A wrong first try still helps.¿Todavía no lo intentaron? Ciérrenla y hagan un intento primero. Un primer intento equivocado también ayuda.
Why:Por qué: x ≤ 10 means 10 IS included (closed circle) and values less than or equal to 10 are shaded (left).x ≤ 10 significa que 10 SÍ está incluido (círculo cerrado) y se sombrean los valores menores o iguales que 10 (hacia la izquierda).
Say the question in your own words. Circle what you know and underline what you need to find.
Explica la pregunta con tus propias palabras. Encierra lo que sabes y subraya lo que debes hallar.
For each row ask two questions: does 6 make the inequality true (circle type)? And do bigger or smaller numbers work (shade direction)?
En cada fila pregunta dos cosas: ¿el 6 hace verdadera la desigualdad (tipo de círculo)? ¿Y funcionan los números mayores o los menores (dirección del sombreado)?
Start here: All three rows use the same boundary, 6 — only the symbol changes. Watch how one small bar changes the whole graph.
Empieza aquí: Las tres filas usan el mismo límite, 6: solo cambia el símbolo. Observa cómo una barrita cambia toda la gráfica.
Complete the table comparing how different symbols affect the graph.Completa la tabla comparando cómo los distintos símbolos afectan la gráfica.
👪 Encourage your student to show work on paper if a box feels tricky.👪 Animen a mostrar el trabajo en papel si una casilla se siente difícil.
| InequalityDesigualdad | Circle TypeTipo de círculo | Shade DirectionDirección del sombreado | Is x = boundary a solution?¿x = valor límite es una solución? |
|---|---|---|---|
| x > 6 |
|
|
No — 6 > 6 is falseNo: 6 > 6 es falso |
| x ≥ 6 |
|
|
Yes — 6 ≥ 6 is trueSí: 6 ≥ 6 es verdadero |
| x ≤ 6 |
|
|
Yes — 6 ≤ 6 is trueSí: 6 ≤ 6 es verdadero |
Answer key for families — compare, then talk about why.Clave de respuestas para la familia — comparen y hablen del porqué.
Not tried yet? Close this and give it one try first. A wrong first try still helps.¿Todavía no lo intentaron? Ciérrenla y hagan un intento primero. Un primer intento equivocado también ayuda.
Why:Por qué: All three rows share the boundary 6, so only the symbol changes the graph. For x > 6, 6 > 6 is false → open circle, shade right; for x ≥ 6, 6 ≥ 6 is true → closed circle, shade right; for x ≤ 6, 6 ≤ 6 is true → closed circle, shade left. Testing the boundary number in the inequality tells you the circle type every time.Las tres filas comparten la frontera 6, así que solo el símbolo cambia la gráfica. Para x > 6, 6 > 6 es falso → círculo abierto, sombrea a la derecha; para x ≥ 6, 6 ≥ 6 es verdadero → círculo cerrado, sombrea a la derecha; para x ≤ 6, 6 ≤ 6 es verdadero → círculo cerrado, sombrea a la izquierda. Probar el número frontera en la desigualdad te dice siempre el tipo de círculo.
Pick a game and play as a team. Nothing here is timed, and every game can be replayed as many times as you like. Escojan un juego y jueguen en equipo. Nada aquí tiene cronómetro, y pueden repetir cada juego cuantas veces quieran.
Try the recommended mission. Student: explain; partner: ask one question, then switch. Paper drawings work for every object. Prueba la misión recomendada. Estudiante: explica; acompañante: haz una pregunta, luego cambien. Puedes dibujar los objetos en papel.
One mission is enough. You can also work solo and explain in writing.Una misión es suficiente. También puedes trabajar a solas y explicar por escrito.
You have $12 and want at least $20. Write and solve an inequality for the extra money. Graph it, then test the boundary and one value on each side.
Tienes $12 y quieres al menos $20. Escribe y resuelve una desigualdad para el dinero adicional. Represéntala y prueba el límite y un valor a cada lado.
Show a labeled drawing, table, or equation. Your partner asks one question; working alone, write your explanation.
Muestra un dibujo con etiquetas, una tabla o una ecuación. Tu acompañante hace una pregunta; a solas, escribe tu explicación.
Choose ONE game. Quick Quiz practices this lesson; the other games review related skills. Play together or solo, without a timer. Elige UN juego. Reto rápido practica esta lección; los demás repasan temas relacionados. Juega acompañado o a solas, sin cronómetro.
Build a chain. The left side of each domino is the match for the problem on the end of the chain. Tap the domino that fits next. Armen una cadena. El lado izquierdo de cada ficha es la pareja del problema al final de la cadena. Toquen la ficha que encaja.
🎉 Chain complete! The last problem links back to the first domino: a perfect loop.¡Cadena completa! El último problema conecta con la primera ficha: un círculo perfecto.
Take turns — student answers one, then a family member answers the next. Watch for the trick statements! Por turnos: el estudiante responde una y luego un familiar responde la siguiente. ¡Cuidado con las trampas!
Tap a card, then tap the bin it belongs in. Talk it through before you tap! Toquen una tarjeta y luego el cesto al que pertenece. ¡Conversen antes de tocar!
Everyone votes and says WHY. Then tap to see what the math says — sometimes it is a tie! Todos votan y dicen POR QUÉ. Luego toquen para ver qué dicen las matemáticas: ¡a veces es empate!
🔎 What the math saysLo que dicen las matemáticas
Reinforce tonight's topic with a quick family game. You ask; your student decides! Refuercen el tema de hoy con un juego rápido en familia. ¡Ustedes preguntan; su estudiante decide!
🎮 Play together! Test values: substitute to see if the inequality is true. 🎮 ¡Jueguen juntos! Prueben valores: sustituyan para ver si la desigualdad es verdadera.
The bigger review game for tonight's lesson — sort, match and choose. A wrong answer gives a hint and lets your student try again. No timer. El juego de repaso más grande para la lección de hoy — clasificar, emparejar y elegir. Si se equivocan, reciben una pista y lo intentan otra vez. Sin cronómetro.
Explain one answer aloud or on paper: “I got ___ because ___. I checked by ___.” Include your strategy and units. Then you are done.Explica una respuesta en voz alta o en papel: “Obtuve ___ porque ___. Comprobé usando ___.” Incluye tu estrategia y las unidades. Después termina.
Name one strategy that helped, or one question to ask next time. You can stop here; no adult signature is needed.
Di una estrategia que te ayudó o una pregunta para la próxima vez. Puedes terminar aquí; no necesitas la firma de un adulto.
Answers save automatically on this device. Tap Check This Problem anytime. Las respuestas se guardan solas en este dispositivo. Toquen Revisar esta pregunta cuando quieran.
These extras are not required. Photos, recordings and reflections stay on this device. To send anything to Mr. Neft, use ClassDojo.Estos extras no son obligatorios. Las fotos, grabaciones y reflexiones quedan en este dispositivo. Para enviar algo al Sr. Neft, usa ClassDojo.
Saved on:Guardado el:
🔥 1-Night StreakRacha de 1 noche
Question draft (not sent):Borrador de pregunta (no enviado):
Family reflection:Reflexión familiar:
Student Work Photo:Foto del trabajo:
Student Voice Memo:Nota de voz del estudiante:
A personal record of practice for . Saved on this device; not submitted to the teacher.
Practice partner (optional)
Date
Use this as a photobooth for the work itself: point the camera at tonight's notebook page, the scratchpad or the whiteboard and take the picture — or pose holding it up. Choose a frame, add stickers, then download it, print it, or add it to your optional reflection. The photo is never uploaded; it stays on this device. Úsenla como cabina de fotos del trabajo: apunten la cámara a la página del cuaderno, al borrador o a la pizarra y tomen la foto, o posen sosteniéndola. Elijan un marco, agreguen calcomanías y luego descárguenla, imprímanla o agréguenla a la reflexión opcional. La foto nunca se sube a internet; se queda en este dispositivo.
Camera Ready!¡Cámara lista!
Tap “Start Camera” to photograph tonight’s work, or use “Upload Work” below. The photo stays on this device.Toca “Iniciar Cámara” para fotografiar el trabajo de hoy, o usa “Subir Foto”. La foto se queda en este dispositivo.
Holding your open notebook or paper up next to your smile makes the best shot! You can also snap a photo of just your written work. ¡Sostener el cuaderno abierto junto a su sonrisa crea la mejor foto! También pueden tomar la foto solo de su trabajo escrito.
What number is the boundary, where the shading starts?
¿Cuál es el número límite, donde comienza el sombreado?
Does the symbol have a line under it? That tells us open or closed circle.
¿El símbolo tiene una línea debajo? Eso nos dice círculo abierto o cerrado.
Which way are the answers — bigger numbers or smaller numbers?
¿Hacia dónde están las respuestas — números mayores o menores?
Always use a closed circle, it doesn't matter which symbol.
Usa siempre un círculo cerrado, no importa qué símbolo sea.
Always shade to the right.
Sombrea siempre a la derecha.
x < 5 and x ≤ 5 graph exactly the same way.
x < 5 y x ≤ 5 se grafican exactamente igual.
These links go to specific videos and lessons about tonight's topic — not general math pages. Estos enlaces van a videos y lecciones específicas sobre el tema de hoy — no páginas generales.